Home » POLYMORPH
Category Archives: POLYMORPH
 DRUG APPROVALS BY DR ANTHONY MELVIN CRASTO
.....FOR BLOG HOME CLICK HERE
DRUG APPROVALS BY DR ANTHONY MELVIN CRASTO
.....FOR BLOG HOME CLICK HEREFlag and hits
ORGANIC SPECTROSCOPY

SUBSCRIBE

 Subscribe in a reader
Enter your email address:
Delivered by FeedBurner
Subscribe to New Drug Approvals by Email![]()

![]()


![]()
![]()


Recent Comments
| shivkr2 on SPSR Excellence Award 2025 – S… | |
| Bonkasaurus on Infigratinib phosphate | |
| PALOVAROTENE | ORGAN… on Palovarotene | |
| Pfizer just purchase… on Temanogrel | |
| Pfizer To Cash In On… on Temanogrel |
Lupin Ltd, New patent, Pitavastatin, WO 2016005919

Formula (1)
Lupin Ltd, New patent, Pitavastatin, WO 2016005919
MANE, Narendra, Dattatray; (IN).
NEHATE, Sagar, Purushottam; (IN).
GODBOLE, Himanshu, Madhav; (IN).
SINGH, Girij, Pal; (IN)
![]()
The present invention is directed to polymorphic forms of Pitavastatin sodium and processes for preparation of the same
Novel crystalline polymorphic forms (I and II) and an amorphous form of pitavastatin, useful for treating hyperlipidemia and mixed dyslipidemia.
Also claims a method for preparing the crystalline and amorphous forms of pitavastatin. In January 2016, Newport Premium™ reported that Lupin holds an active US DMF for pitavastatin calcium since July 2013.
Nissan Chemical Industries and licensee Kowa, with sub-licensees Sankyo, Eli Lilly, Esteve, JW Pharmaceutical, Recordati, Laboratorios Delta and Zydus-Cadila, have developed and launched pitavastatin.
WO2014203045, claiming a process for preparing an intermediate useful in the synthesis of statins (eg pitavastatin).
Pitavastatin is a cholesterol lowering agent of the class of HMG-CoA reductase inhibitor. The HMG-CoA reductase enzyme catalyzes the conversions of HMG- CoA to mevalonate. Inhibitors of HMG-CoA reductase are commonly referred to as “statins.” Statins are therapeutically effective drugs used for reducing low density lipoprotein (LDL) particle concentration in the blood stream of patients at risk for cardiovascular disease.
Pitavastatin is one of the synthetic statins which is chemically known as (3R, 5S, 6E)-7-[2-cyclopropyl-4-(4-fluorophenyl) quinoline-3-yl]-3, 5-dihydroxy-6- heptenoic acid represented by structural formula (1):
Formula (1)
Pitavastatin and its pharmaceutically acceptable salts are described in US 5,753,675 patent and US 5,856,336 patent, respectively.
Processes for the preparation of Pitavastatin are well documented in the literature. European patents, EP 0304063 and EP 1099694 and reports by Miyachi et al (Tetrahedron Letters
(1993) vol. 34, pages 8267-8270) and Takahashi et al (Bull. Chem. Soc. Japan (1995) Vol. 68, 2649-2656) describe processes for preparation of Pitavastatin.
US 5,872,130 patent discloses sodium salt of Pitavastatin. This patent, however, is silent about the solid state form of Pitavastatin Sodium.
It is generally known in the art that active pharmaceutical ingredients frequently do not exhibit the range of physical properties that makes them directly suitable for development. One of the approaches that is used to modify the characteristics of drug substances is to employ a salt form of the substance, since salts enable one to modify aqueous solubility, dissolution rate, solution pH, crystal form, hygroscopicity, chemical stability, melting point and even mechanical properties. The beneficial aspects of using salt forms of active pharmaceutical ingredients are well known and represent one of the means to increase the degree of solubility of otherwise intractable substances and to increase bioavailability.
Although the known salts of Pitavastatin like sodium, potassium, magnesium, calcium etc. and their polymorphic forms may address some of the deficiencies in terms of formulated product and its manufacturability. There remains a need for yet further improvement in these properties as well as improvements in other properties such as flowability, and solubility.
Polymorphism is a known phenomenon among pharmaceutical substances. It is commonly defined as the ability of any substance to exist in two or more crystalline phases that have a different arrangement and/or conformation of the molecules in the crystal lattice. Different polymorphic forms of the same pharmaceutically active moiety also differ in their physical properties such as melting point, solubility, chemical reactivity, etc. These properties may also appreciably influence pharmaceutical properties such as dissolution rate and bioavailability.
Further, the discovery of new polymorphic forms and solvates of an active pharmaceutical ingredient provides broader scope to a formulation scientist for formulation optimization, for example by providing a product with different properties, e.g., better processing or handling characteristics, improved dissolution profile, or improved shelf-life. For at least these reasons, there is a need for polymorphs of Pitavastatin salts such as Pitavastatin sodium.
New polymorphic forms and hydrates and/or solvates of a pharmaceutically acceptable salt of Pitavastatin can also provide an opportunity to improve the performance characteristics of a pharmaceutical product.
Therefore, there is a scope to prepare novel polymorphic forms of Pitavastatin sodium and hydrates and/or solvates.
Example-1: Preparation of Pitavastatin Sodium (Form-I)
A mixture of 40.0 gm Pitavastatin acid and 120 ml water was cooled to 15-20 °C temperature. Thereafter aqueous solution of sodium hydroxide (4.0 gm) in water (20 ml) was added to the reaction mixture. The reaction mixture was stirred for 30-45 min at 15-20 °C temperature. Ethyl acetate (80ml) was added into the reaction mixture at 15-20 °C temperature, stirred for 15-20 min and the layers were separated. The aqueous layer was filtered and acetonitrile (1200 ml) was gradually added to the aqueous layer under stirring till the precipitation was completed. The reaction mixture was cooled to 5-8 °C temperature and stirred for 2-3 hours at 5-8 °C temperature. The precipitated solid was filtered, washed with acetonitrile (40ml) and dried at 45-50 °C temperature under vacuum for 10-12 hours to afford the title compound (28.0 gm).
Yield (w/w): 0.70 (66.0%)
HPLC purity: 99.70 %
Example-2: Preparation of Pitavastatin Sodium (Form-II)
A mixture of 40.0 gm of Pitavastatin acid and 120 ml of water was cooled to 15-20°C temperature under stirring. Thereafter aqueous solution of sodium hydroxide (4.0 gm) in water (20 ml) was added to the reaction mixture. The reaction mixture was stirred for 30-45 min at 15-20 °C temperature. Ethyl acetate (80ml) was added to the reaction mixture at 15-20 °C temperature, stirred for 15-20 min and the layers were separated. The aqueous layer was filtered and acetonitrile (1200 ml) was gradually added to the aqueous layer under stirring till the precipitation was completed. The reaction mixture was cooled to 5-8 °C temperature and stirred for 2-3 hours at 5-8 °C temperature. The precipitated solid was filtered, washed with acetonitrile (40ml) and dried at 45-50 °C temperature under vacuum for 10-12 hours and kept in a petri dish at 25-30 °C and 60 ± 5 RH (relative humidity) for 18-24 hours to afford the title compound (31.6 gm).
Yield (w/w): 0.79 (65.8%)
HPLC purity: 99.70 %
Example-3: Preparation of Pitavastatin Sodium Amorphous
Pitavastatin sodium (3.0 gm) and ethanol (60 ml) were taken in a round bottomed flask at 25-30 °C temperature. The reaction mixture was filtered and the solvent was distilled off on rotatory evaporator under vacuum maintaining bath temperature at 45-50 °C temperature. Thereafter the reaction mixture was degassed under vacuum for 2-3 hours to afford the title compound (2.8gm).
HPLC purity: 99.70 %.
SEE……..https://patentscope.wipo.int/search/en/detail.jsf?docId=WO2016005919&redirectedID=true
/////////Lupin Ltd, New patent, Pitavastatin, WO 2016005919, statins, POLYMORPH
Polymorph case study……….Duvelisib


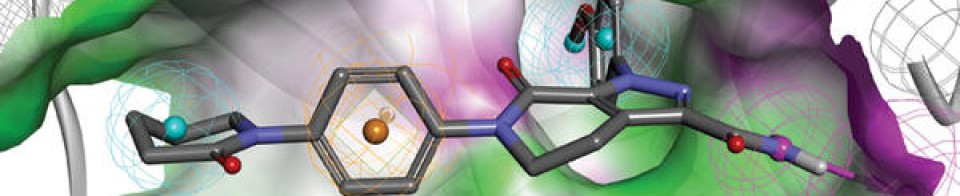
Duvelisib
Infinity and AbbVie partner to develop and commercialise duvelisib for cancer
INK 1197; IPI 145; 8-Chloro-2-phenyl-3-[(1S)-1-(9H-purin-6-ylamino)ethyl]-1(2H)-isoquinolinone
1(2H)-Isoquinolinone, 8-chloro-2-phenyl-3-((1S)-1-(9H-purin-6-ylamino)ethyl)-
8-Chloro-2-phenyl-3-((1S)-1-(7H-purin-6-ylamino)ethyl)isoquinolin-1(2H)-one
(S)-3-(l-(9H-purin-6-ylamino)ethyl)-8-chloro-2-phenylisoquinolin-l(2H)-one
UNII-610V23S0JI; IPI-145; INK-1197;
Originator…….. Millennium Pharmaceuticals
| Molecular Formula | C22H17ClN6O | |
| Molecular Weight | 416.86 | |
| CAS Registry Number | 1201438-56-3 |

Infinity Pharmaceuticals has partnered with AbbVie to develop and commercialise its duvelisib (IPI-145), an oral inhibitor of phosphoinositide-3-kinase (PI3K)-delta and PI3K-gamma, to treat patients with cancer.

Duvelisib
The filing of patents claiming new crystalline forms, usually 4−6 years after the original product patent, is a typical strategy applied by such companies to extend patent protection. This patent protection approach by big pharma forces generic bulk producers to discover and file patents on new polymorphs if they want to market the drug after expiry of the product patents.
Polymorphism is of paramount importance due to its effect on some physical characteristics of powders such as melting point, flowability, vapour pressure, bulk density, chemical reactivity, apparent solubility and dissolution rate, and optical and electrical properties. In other words, polymorphism can affect drug stability, manipulation, and bioavailability
the principal aim of generic bulk producers was to generate a competitive market advantage by protecting their new crystal form.
Polymorphic forms of a compound of Formula (I):.US8809349

herein referred to as Form A, Form B, Form C, Form D, Form E, Form F, Form G, Form H, Form I, Form J, or an amorphous form of a compound of Formula (I), or a salt, solvate, or hydrate thereof; or a mixture of two or more thereof. In one embodiment, the polymorphic form of a compound of Formula (I) can be a crystalline form, a partially crystalline form, an amorphous form, or a mixture of crystalline form(s) and/or amorphous form(s).
(XRPD) peaks
“Enantiomerically pure”
As used herein, and unless otherwise specified, the term “enantiomerically pure” means a stereomerically pure composition of a compound having one or more chiral center(s).
As used herein, and unless otherwise specified, the terms “enantiomeric excess” and “diastereomeric excess” are used interchangeably herein. In some embodiments, compounds with a single stereocenter can be referred to as being present in “enantiomeric excess,” and those with at least two stereocenters can be referred to as being present in “diastereomeric excess.” For example, the term “enantiomeric excess” is well known in the art and is defined as:
eea=(conc.ofa-conc.ofbconc.ofa+conc.ofb)×100
Thus, the term “enantiomeric excess” is related to the term “optical purity” in that both are measures of the same phenomenon. The value of ee will be a number from 0 to 100, zero being racemic and 100 being enantiomerically pure. A compound which in the past might have been called 98% optically pure is now more precisely characterized by 96% ee. A 90% ee reflects the presence of 95% of one enantiomer and 5% of the other(s) in the material in question.
Some compositions described herein contain an enantiomeric excess of at least about 50%, 75%, 90%, 95%, or 99% of the S enantiomer. In other words, the compositions contain an enantiomeric excess of the S enantiomer over the R enantiomer. In other embodiments, some compositions described herein contain an enantiomeric excess of at least about 50%, 75%, 90%, 95%, or 99% of the R enantiomer. In other words, the compositions contain an enantiomeric excess of the R enantiomer over the S enantiomer.
GRAPHS
FIG. 1 shows an X-ray powder diffraction (XRPD) for Polymorph Form A.
FIG. 2 shows an XRPD for Polymorph Form B.
FIG. 3 shows an XRPD for Polymorph Form C.
FIG. 4 shows an XRPD for Polymorph Form D.
FIG. 5 shows an XRPD for Polymorph Form E.
FIG. 6 shows an XRPD for Polymorph Form F.
FIG. 7 shows an XRPD for Polymorph Form G.
FIG. 8 shows an XRPD for Polymorph Form H.
FIG. 9 shows an XRPD for Polymorph Form I.
FIG. 10 shows an XRPD for Polymorph Form J.
FIG. 11 shows an XRPD for amorphous compound of Formula (I).
FIG. 12 shows a differential scanning calorimetry (DSC) thermogram for Polymorph Form A.
FIG. 13 shows a DSC for Polymorph Form B.
FIG. 14 shows a DSC for Polymorph Form C.
FIG. 15 shows a DSC for Polymorph Form D.
FIG. 16 shows a DSC for Polymorph Form E.
FIG. 17 shows a DSC for Polymorph Form F.
FIG. 18 shows a DSC for Polymorph Form G.
FIG. 19 shows a DSC for Polymorph Form H.
FIG. 20 shows a DSC for Polymorph Form I.
FIG. 21 shows a DSC for Polymorph Form J.
FIG. 22 shows a DSC thermogram and a thermogravimetric analysis (TGA) for Polymorph Form A.
FIG. 23 shows two DSC thermograms for Polymorph Form C.
FIG. 24 shows a DSC and a TGA for Polymorph Form F.
FIG. 25 shows a panel of salts tested for formation of crystalline solids in various solvents.
FIG. 26 shows a single crystal X-ray structure of Polymorph Form G MTBE (t-butyl methyl ether) solvate of a compound of Formula (I).
FIG. 27 shows an FT-IR spectra of Polymorph Form C.
FIG. 28 shows a 1H-NMR spectra of Polymorph Form C.
FIG. 29 shows a 13C-NMR spectra of Polymorph Form C.
FIG. 30 shows a dynamic vapor sorption (DVS) analysis of Polymorph Form C.
FIG. 31 shows representative dissolution profiles of capsules containing Polymorph Form C.
DRAWINGS
FIG. 1 shows an X-ray powder diffraction (XRPD) for Polymorph Form A.

FIG. 1 shows a representative X-ray powder diffraction (XRPD) for polymorph Form A.
In one embodiment, polymorph Form A can be characterized by any one, two, three, four, five, six, seven, eight, nine, ten, or more of significant peak(s) of FIG. 1. In one embodiment, polymorph Form A can be characterized as having at least one XRPD peak selected from 2θ=9.6° (±0.2°), 12.2° (±0.2°), and 18.3° (±0.2°). In one embodiment, polymorph Form A can be characterized as having at least one XRPD peak selected from 2θ=9.6° (±0.2°), 12.2° (±0.2°), and 18.3° (±0.2°) in combination with at least one XRPD peak selected from 2θ=15.6° (±0.2°) and 19.2° (±0.2°). In another embodiment, polymorph Form A can be characterized as having at least one XRPD peak selected from 2θ=9.6° (±0.2°), 12.2° (±0.2°), 15.6° (±0.2°), 18.3° (±0.2°), and 19.2° (±0.2°) in combination with at least one XRPD peak selected from 2θ=9.1° (±0.2°), 9.4° (±0.2°), 12.4° (±0.2°), 14.8° (±0.2°), 16.3° (±0.2°), 17.7° (±0.2°), 21.1° (±0.2°), 21.9° (±0.2°), 24.0° (±0.2°), and 26.9° (±0.2°). In one embodiment, polymorph Form A can be characterized in that it has substantially all of the peaks in its XRPD pattern as shown in FIG. 1.
FIG. 2 shows an XRPD for Polymorph Form B.

FIG. 2 shows a representative XRPD for polymorph Form B.
In one embodiment, polymorph Form B can be characterized by any one, two, three, four, five, six, seven, eight, nine, ten, or more of significant peak(s) of FIG. 2. In one embodiment, polymorph Form B can be characterized as having at least one XRPD peak selected from 2θ=7.9° (±0.2°), 13.4° (±0.2°), and 23.4° (±0.2°). In one embodiment, polymorph Form B can be characterized as having at least one XRPD peak selected from 2θ=7.9° (±0.2°), 13.4° (±0.2°), and 23.4° (±0.2°) in combination with at least one XRPD peak selected from 2θ=14.0° (±0.2°) and 15.0° (±0.2°). In another embodiment, polymorph Form B can be characterized as having at least one XRPD peak selected from 2θ=7.9° (±0.2°), 13.4° (±0.2°), 14.0° (±0.2°), 15.0° (±0.2°), and 23.4° (±0.2°) in combination with at least one XRPD peak selected from 2θ=9.5° (±0.2°), 12.7° (±0.2°), 13.6° (±0.2°), 14.2° (±0.2°), 15.7° (±0.2°), 19.0° (±0.2°), 22.3° (±0.2°), 24.2° (±0.2°), 24.8° (±0.2°), and 26.9° (±0.2°). In one embodiment, polymorph Form B can be characterized in that it has substantially all of the peaks in its XRPD pattern as shown in FIG. 2.
FIG. 3 shows an XRPD for Polymorph Form C.
In one embodiment, polymorph Form C can be characterized by any one, two, three, four, five, six, seven, eight, nine, ten, or more of significant peak(s) of FIG. 3. In one embodiment, Form C can be characterized by having at least one XRPD peak selected from 2θ=10.5° (±0.2°), 13.7° (±0.2°), and 24.5° (±0.2°). In another embodiment, Form C can be characterized by having at least one XRPD peak selected from 2θ=10.4° (±0.2°), 13.3° (±0.2°), and 24.3° (±0.2°). In one embodiment, polymorph Form C can be characterized as having at least one XRPD peak selected from 2θ=10.4° (±0.2°), 13.3° (±0.2°), and 24.3° (±0.2°) in combination with at least one XRPD peak selected from 2θ=6.6° (±0.2°) and 12.5° (±0.2°). In another embodiment, polymorph Form C can be characterized as having at least one XRPD peak selected from 2θ=6.6° (±0.2°), 10.4° (±0.2°), 12.5° (±0.2°), 13.3° (±0.2°), and 24.3° (±0.2°) in combination with at least one XRPD peak selected from 2θ=8.8° (±0.2°), 9.9° (±0.2°), 13.4° (±0.2°), 15.5° (±0.2°), 16.9° (±0.2°), 19.8° (±0.2°), 21.3° (±0.2°), 23.6° (±0.2°), 25.3° (±0.2°), and 27.9° (±0.2°). In one embodiment, polymorph Form C can be characterized in that it has substantially all of the peaks in its XRPD pattern as shown in FIG. 3.

FIG. 4 shows an XRPD for Polymorph Form D.

In one embodiment, polymorph Form D can be characterized by any one, two, three, four, five, six, seven, eight, nine, ten, or more of significant peak(s) of FIG. 4. In one embodiment, polymorph Form D can be characterized as having at least one XRPD peak selected from 2θ=11.4° (±0.2°), 17.4° (±0.2°), and 22.9° (±0.2°). In one embodiment, polymorph Form D can be characterized as having at least one XRPD peak selected from 2θ=11.4° (±0.2°), 17.4° (±0.2°), and 22.9° (±0.2°) in combination with at least one XRPD peak selected from 2θ=9.2° (±0.2°) and 18.3° (±0.2°). In another embodiment, polymorph Form D can be characterized as having at least one XRPD peak selected from 2θ=9.2° (±0.2°), 11.4° (±0.2°), 17.4° (±0.2°), 18.3° (±0.2°), and 22.9° (±0.2°) in combination with at least one XRPD peak selected from 2θ=9.8° (±0.2°), 12.2° (±0.2°), 15.8° (±0.2°), 16.2° (±0.2°), 16.8° (±0.2°), 18.9° (±0.2°), 19.9° (±0.2°), 20.0° (±0.2°), 24.9° (±0.2°), and 29.3° (±0.2°). In one embodiment, polymorph Form D can be characterized in that it has substantially all of the peaks in its XRPD pattern as shown in FIG. 4.
FIG. 5 shows an XRPD for Polymorph Form E. US8809349
In one embodiment, polymorph Form E can be characterized by any one, two, three, four, five, six, seven, eight, nine, ten, or more of significant peak(s) of FIG. 5. In one embodiment, polymorph Form E can be characterized as having at least one XRPD peak selected from 2θ=6.7° (±0.2°), 9.3° (±0.2°), and 24.4° (±0.2°). In one embodiment, polymorph Form E can be characterized as having at least one XRPD peak selected from 2θ=6.7° (±0.2°), 9.3° (±0.2°), and 24.4° (±0.2°) in combination with at least one XRPD peak selected from 2θ=12.7° (±0.2°) and 13.9° (±0.2°). In another embodiment, polymorph Form E can be characterized as having at least one XRPD peak selected from 2θ=6.7° (±0.2°), 9.3° (±0.2°), 12.7° (±0.2°), 13.9° (±0.2°), and 24.4° (±0.2°) in combination with at least one XRPD peak selected from 2θ=12.4° (±0.2°), 13.3° (±0.2°), 14.3° (±0.2°), 15.5° (±0.2°), 17.4° (±0.2°), 18.5° (±0.2°), 22.0° (±0.2°), 23.9° (±0.2°), 24.1° (±0.2°), and 26.4° (±0.2°). In one embodiment, polymorph Form E can be characterized in that it has substantially all of the peaks in its XRPD pattern as shown in FIG. 5.
FIG. 6 shows an XRPD for Polymorph Form F. US8809349
In one embodiment, polymorph Form F can be characterized by any one, two, three, four, five, six, seven, eight, nine, ten, or more of significant peak(s) of FIG. 6. In one embodiment, polymorph Form F can be characterized as having at least one XRPD peak selected from 2θ=9.6° (±0.2°), 17.3° (±0.2°), and 24.6° (±0.2°). In one embodiment, polymorph Form F can be characterized as having at least one XRPD peak selected from 2θ=9.6° (±0.2°), 17.3° (±0.2°), and 24.6° (±0.2°) in combination with at least one XRPD peak selected from 2θ=14.0° (±0.2°) and 19.2° (±0.2°). In another embodiment, polymorph Form F can be characterized as having at least one XRPD peak selected from 2θ=9.6° (±0.2°), 14.0° (±0.2°), 17.3° (±0.2°), 19.2° (±0.2°), and 24.6° (±0.2°) in combination with at least one XRPD peak selected from 2θ=12.4° (±0.2°), 16.1° (±0.2°), 16.6° (±0.2°), 17.1° (±0.2°), 20.8° (±0.2°), 21.5° (±0.2°), 22.0° (±0.2°), 24.3° (±0.2°), 25.2° (±0.2°), and 25.4° (±0.2°). In one embodiment, polymorph Form F can be characterized in that it has substantially all of the peaks in its XRPD pattern as shown in FIG. 6.
FIG. 7 shows an XRPD for Polymorph Form G. US8809349
In one embodiment, polymorph Form G can be characterized by any one, two, three, four, five, six, seven, eight, nine, ten, or more of significant peak(s) of FIG. 7. In one embodiment, polymorph Form G can be characterized as having at least one XRPD peak selected from 2θ=6.7° (±0.2°), 9.5° (±0.2°), and 19.0° (±0.2°). In one embodiment, polymorph Form G can be characterized as having at least one XRPD peak selected from 2θ=6.7° (±0.2°), 9.5° (±0.2°), and 19.0° (±0.2°) in combination with at least one XRPD peak selected from 2θ=10.6° (±0.2°) and 19.6° (±0.2°). In another embodiment, polymorph Form G can be characterized as having at least one XRPD peak selected from 2θ=6.7° (±0.2°), 9.5° (±0.2°), 10.6° (±0.2°), 19.0° (±0.2°), and 19.6° (±0.2°) in combination with at least one XRPD peak selected from 2θ=13.4° (±0.2°), 15.0° (±0.2°), 15.8° (±0.2°), 17.8° (±0.2°), 20.7° (±0.2°), 21.2° (±0.2°), 22.8° (±0.2°), 23.8° (±0.2°), 24.3° (±0.2°), and 25.6° (±0.2°). In one embodiment, polymorph Form G can be characterized in that it has substantially all of the peaks in its XRPD pattern as shown in FIG. 7.
FIG. 8 shows an XRPD for Polymorph Form H. US8809349
In one embodiment, polymorph Form H can be characterized by any one, two, three, four, five, six, seven, eight, nine, ten, or more of significant peak(s) of FIG. 8. In one embodiment, polymorph Form H can be characterized as having at least one XRPD peak selected from 2θ=8.9° (±0.2°), 9.2° (±0.2°), and 14.1° (±0.2°). In one embodiment, polymorph Form H can be characterized as having at least one XRPD peak selected from 2θ=8.9° (±0.2°), 9.2° (±0.2°), and 14.1° (±0.2°) in combination with at least one XRPD peak selected from 2θ=17.3° (±0.2°) and 18.5° (±0.2°). In another embodiment, polymorph Form H can be characterized as having at least one XRPD peak selected from 2θ=8.9° (±0.2°), 9.2° (±0.2°), 14.1° (±0.2°), 17.3° (±0.2°), and 18.5° (±0.2°) in combination with at least one XRPD peak selected from 2θ=7.1° (±0.2°), 10.6° (±0.2°), 11.3° (±0.2°), 11.6° (±0.2°), 16.2° (±0.2°), 18.3° (±0.2°), 18.8° (±0.2°), 20.3° (±0.2°), 21.7° (±0.2°), and 24.7° (±0.2°). In one embodiment, polymorph Form H can be characterized in that it has substantially all of the peaks in its XRPD pattern as shown in FIG. 8.
FIG. 9 shows an XRPD for Polymorph Form I.
In one embodiment, polymorph Form I can be characterized by any one, two, three, four, five, six, seven, eight, nine, ten, or more of significant peak(s) of FIG. 9. In one embodiment, polymorph Form I can be characterized as having at least one XRPD peak selected from 2θ=9.7° (±0.2°), 19.3° (±0.2°), and 24.5° (±0.2°). In one embodiment, polymorph Form I can be characterized as having at least one XRPD peak selected from 2θ=9.7° (±0.2°), 19.3° (±0.2°), and 24.5° (±0.2°) in combination with at least one XRPD peak selected from 2θ=11.4° (±0.2°) and 14.2° (±0.2°). In another embodiment, polymorph Form I can be characterized as having at least one XRPD peak selected from 2θ=9.7° (±0.2°), 11.4° (±0.2°), 14.2° (±0.2°), 19.3° (±0.2°), and 24.5° (±0.2°) in combination with at least one XRPD peak selected from 2θ=9.2° (±0.2°), 14.7° (±0.2°), 15.5° (±0.2°), 16.7° (±0.2°), 17.3° (±0.2°), 18.4° (±0.2°), 21.4° (±0.2°), 22.9° (±0.2°), 29.1° (±0.2°), and 34.1° (±0.2°). In one embodiment, polymorph Form I can be characterized in that it has substantially all of the peaks in its XRPD pattern as shown in FIG. 9.
FIG. 10 shows an XRPD for Polymorph Form J.
In one embodiment, polymorph Form J can be characterized by any one, two, three, four, five, six, seven, eight, nine, ten, or more of significant peak(s) of FIG. 10. In one embodiment, polymorph Form J can be characterized as having at least one XRPD peak selected from 2θ=9.1° (±0.2°), 17.3° (±0.2°), and 18.3° (±0.2°). In one embodiment, polymorph Form J can be characterized as having at least one XRPD peak selected from 2θ=9.1° (±0.2°), 17.3° (±0.2°), and 18.3° (±0.2°) in combination with at least one XRPD peak selected from 2θ=16.4° (±0.2°) and 17.9° (±0.2°). In another embodiment, polymorph Form J can be characterized as having at least one XRPD peak selected from 2θ=9.1° (±0.2°), 16.4° (±0.2°), 17.3° (±0.2°), 17.9° (±0.2°), and 18.3° (±0.2°) in combination with at least one XRPD peak selected from 2θ=9.4° (±0.2°), 10.1° (±0.2°), 10.7° (±0.2°), 14.0° (±0.2°), 14.3° (±0.2°), 15.5° (±0.2°), 16.9° (±0.2°), 19.9° (±0.2°), 24.0° (±0.2°), and 24.7° (±0.2°). In one embodiment, polymorph Form J can be characterized in that it has substantially all of the peaks in its XRPD pattern as shown in FIG. 10.
FIG. 11 shows an XRPD for amorphous compound of Formula (I).
FIG. 12 shows a differential scanning calorimetry (DSC) thermogram for Polymorph Form A.
FIG. 13 shows a DSC for Polymorph Form B.
FIG. 14 shows a DSC for Polymorph Form C.
FIG. 15 shows a DSC for Polymorph Form D.
FIG. 16 shows a DSC for Polymorph Form E.
FIG. 17 shows a DSC for Polymorph Form F.
FIG. 18 shows a DSC for Polymorph Form G.
FIG. 19 shows a DSC for Polymorph Form H.
FIG. 20 shows a DSC for Polymorph Form I.
FIG. 21 shows a DSC for Polymorph Form J.
FIG. 22 shows a DSC thermogram and a thermogravimetric analysis (TGA) for Polymorph Form A.
FIG. 23 shows two DSC thermograms for Polymorph Form C.
FIG. 24 shows a DSC and a TGA for Polymorph Form F.
FIG. 25 shows a panel of salts tested for formation of crystalline solids in various solvents.
FIG. 26 shows a single crystal X-ray structure of Polymorph Form G MTBE (t-butyl methyl ether) solvate of a compound of Formula (I).
FIG. 27 shows an FT-IR spectra of Polymorph Form C.

FIG. 28 shows a 1H-NMR spectra of Polymorph Form C.

FIG. 29 shows a 13C-NMR spectra of Polymorph Form C.

FIG. 30 shows a dynamic vapor sorption (DVS) analysis of Polymorph Form C.
FIG. 31 shows representative dissolution profiles of capsules containing Polymorph Form C.
Enantiomers
Enantiomers can be isolated from racemic mixtures by any method known to those skilled in the art, including chiral high pressure liquid chromatography (HPLC), the formation and crystallization of chiral salts, or prepared by asymmetric syntheses. See, for example, Enantiomers, Racemates and Resolutions (Jacques, Ed., Wiley Interscience, New York, 1981); Wilen et al., Tetrahedron 33:2725 (1977); Stereochemistry of Carbon Compounds (E. L. Eliel, Ed., McGraw-Hill, NY, 1962); and Tables of Resolving Agents and Optical Resolutions p. 268 (E. L. Eliel, Ed., Univ. of Notre Dame Press, Notre Dame, Ind. 1972).
“Tautomer”
The term “tautomer” is a type of isomer that includes two or more interconvertable compounds resulting from at least one formal migration of a hydrogen atom and at least one change in valency (e.g., a single bond to a double bond, a triple bond to a single bond, or vice versa). “Tautomerization” includes prototropic or proton-shift tautomerization, which is considered a subset of acid-base chemistry. “Prototropic tautomerization” or “proton-shift tautomerization” involves the migration of a proton accompanied by changes in bond order. The exact ratio of the tautomers depends on several factors, including temperature, solvent, and pH. Where tautomerization is possible (e.g., in solution), a chemical equilibrium of tautomers can be reached. Tautomerizations (i.e., the reaction providing a tautomeric pair) can be catalyzed by acid or base, or can occur without the action or presence of an external agent. Exemplary tautomerizations include, but are not limited to, keto-to-enol; amide-to-imide; lactam-to-lactim; enamine-to-imine; and enamine-to-(a different) enamine tautomerizations. An example of keto-enol tautomerization is the interconversion of pentane-2,4-dione and 4-hydroxypent-3-en-2-one tautomers. Another example of tautomerization is phenol-keto tautomerization. Another example of phenol-keto tautomerization is the interconversion of pyridin-4-ol and pyridin-4(1H)-one tautomers.
As defined herein, the term “Formula (I)” includes (S)-3-(1-(9H-purin-6-ylamino)ethyl)-8-chloro-2-phenylisoquinolin-1(2H)-one in its imide tautomer shown below as (1-1) and in its lactim tautomer shown below as (1-2):

“polymorph” can be used herein to describe a crystalline material, e.g., a crystalline form. In certain embodiments, “polymorph” as used herein are also meant to include all crystalline and amorphous forms of a compound or a salt thereof, including, for example, crystalline forms, polymorphs, pseudopolymorphs, solvates, hydrates, co-crystals, unsolvated polymorphs (including anhydrates), conformational polymorphs, tautomeric forms, disordered crystalline forms, and amorphous forms, as well as mixtures thereof, unless a particular crystalline or amorphous form is referred to. Compounds of the present disclosure include crystalline and amorphous forms of those compounds, including, for example, crystalline forms, polymorphs, pseudopolymorphs, solvates, hydrates, co-crystals, unsolvated polymorphs (including anhydrates), conformational polymorphs, tautomeric forms, disordered crystalline forms, and amorphous forms of the compounds or a salt thereof, as well as mixtures thereof.
As used herein, and unless otherwise specified, a particular form of a compound of Formula (I) described herein (e.g., Form A, B, C, D, E, F, G, H, I, J, or amorphous form of a compound of Formula (I), or mixtures thereof) is meant to encompass a solid form of a compound of Formula (I), or a salt, solvate, or hydrate thereof, among others.
The polymorphs made according to the methods provided herein can be characterized by any methodology known in the art. For example, the polymorphs made according to the methods provided herein can be characterized by X-ray powder diffraction (XRPD), differential scanning calorimetry (DSC), thermogravimetric analysis (TGA), dynamic vapor sorption (DVS), hot-stage microscopy, optical microscopy, Karl Fischer analysis, melting point, spectroscopy (e.g., Raman, solid state nuclear magnetic resonance (ssNMR), liquid state nuclear magnetic resonance (1H- and 13C-NMR), and FT-IR), thermal stability, grinding stability, and solubility, among others.
“Solid form”
The terms “solid form” and related terms herein refer to a physical form comprising a compound provided herein or a salt or solvate or hydrate thereof, which is not in a liquid or a gaseous state. Solid forms can be crystalline, amorphous, disordered crystalline, partially crystalline, and/or partially amorphous.
“Crystalline,”
The term “crystalline,” when used to describe a substance, component, or product, means that the substance, component, or product is substantially crystalline as determined, for example, by X-ray diffraction. See, e.g., Remington: The Science and Practice of Pharmacy, Lippincott Williams & Wilkins, 21st ed. (2005).
As used herein, and unless otherwise specified, the term “crystalline form,” “crystal form,” and related terms herein refer to the various crystalline material comprising a given substance, including single-component crystal forms and multiple-component crystal forms, and including, but not limited to, polymorphs, solvates, hydrates, co-crystals and other molecular complexes, as well as salts, solvates of salts, hydrates of salts, other molecular complexes of salts, and polymorphs thereof. In certain embodiments, a crystal form of a substance can be substantially free of amorphous forms and/or other crystal forms. In other embodiments, a crystal form of a substance can contain about 1%, about 2%, about 3%, about 4%, about 5%, about 10%, about 15%, about 20%, about 25%, about 30%, about 35%, about 40%, about 45% or about 50% of one or more amorphous form(s) and/or other crystal form(s) on a weight and/or molar basis.
Certain crystal forms of a substance can be obtained by a number of methods, such as, without limitation, melt recrystallization, melt cooling, solvent recrystallization, recrystallization in confined spaces, such as, e.g., in nanopores or capillaries, recrystallization on surfaces or templates, such as, e.g., on polymers, recrystallization in the presence of additives, such as, e.g., co-crystal counter-molecules, desolvation, dehydration, rapid evaporation, rapid cooling, slow cooling, vapor diffusion, sublimation, grinding, solvent-drop grinding, microwave-induced precipitation, sonication-induced precipitation, laser-induced precipitation, and/or precipitation from a supercritical fluid. As used herein, and unless otherwise specified, the term “isolating” also encompasses purifying.
Characterizing crystal forms and amorphous forms
Techniques for characterizing crystal forms and amorphous forms can include, but are not limited to, thermal gravimetric analysis (TGA), differential scanning calorimetry (DSC), X-ray powder diffractometry (XRPD), single crystal X-ray diffractometry, vibrational spectroscopy, e.g., infrared (IR) and Raman spectroscopy, solid-state nuclear magnetic resonance (NMR) spectroscopy, optical microscopy, hot stage optical microscopy, scanning electron microscopy (SEM), electron crystallography and quantitative analysis, particle size analysis (PSA), surface area analysis, solubility studies, and dissolution studies.
PEAK
As used herein, and unless otherwise specified, the term “peak,” when used in connection with the spectra or data presented in graphical form (e.g., XRPD, IR, Raman, and NMR spectra), refers to a peak or other special feature that one skilled in the art would recognize as not attributable to background noise. The term “significant peak” refers to peaks at least the median size (e.g., height) of other peaks in the spectrum or data, or at least 1.5, 2, or 2.5 times the background level in the spectrum or data.
“Pharmaceutically acceptable carrier”
“pharmaceutically acceptable carrier” or “pharmaceutically acceptable excipient” includes any and all solvents, dispersion media, coatings, antibacterial and antifungal agents, isotonic and absorption delaying agents and the like. The use of such media and agents for pharmaceutically active substances is known in the art. Except insofar as any conventional media or agent is incompatible with the active ingredient, its use in the therapeutic compositions of the present disclosure is contemplated. Supplementary active ingredients can also be incorporated into the compositions.
“Substantially pure”
the term “substantially pure” when used to describe a polymorph, a crystal form, or a solid form of a compound or complex described herein means a solid form of the compound or complex that comprises a particular polymorph and is substantially free of other polymorphic and/or amorphous forms of the compound. A representative substantially pure polymorph comprises greater than about 80% by weight of one polymorphic form of the compound and less than about 20% by weight of other polymorphic and/or amorphous forms of the compound; greater than about 90% by weight of one polymorphic form of the compound and less than about 10% by weight of other polymorphic and/or amorphous forms of the compound; greater than about 95% by weight of one polymorphic form of the compound and less than about 5% by weight of other polymorphic and/or amorphous forms of the compound; greater than about 97% by weight of one polymorphic form of the compound and less than about 3% by weight of other polymorphic and/or amorphous forms of the compound; or greater than about 99% by weight of one polymorphic form of the compound and less than about 1% by weight of other polymorphic and/or amorphous forms of the compound.
“Stable”
The term “stable” refers to a compound or composition that does not readily decompose or change in chemical makeup or physical state. A stable composition or formulation provided herein does not significantly decompose under normal manufacturing or storage conditions. In some embodiments, the term “stable,” when used in connection with a formulation or a dosage form, means that the active ingredient of the formulation or dosage form remains unchanged in chemical makeup or physical state for a specified amount of time and does not significantly degrade or aggregate or become otherwise modified (e.g., as determined, for example, by HPLC, FTIR, or XRPD). In some embodiments, about 70 percent or greater, about 80 percent or greater, about 90 percent or greater, about 95 percent or greater, about 98 percent or greater, or about 99 percent or greater of the compound remains unchanged after the specified period. In one embodiment, a polymorph provided herein is stable upon long-term storage (e.g., no significant change in polymorph form after about 1, 2, 3, 4, 5, 6, 7, 8, 9, 10, 11, 12, 18, 24, 30, 36, 42, 48, 54, 60, or greater than about 60 months).
Amorphous form
In one embodiment, an amorphous form of a compound of Formula (I), or a pharmaceutically acceptable salt, solvate, or hydrate thereof, can be made by dissolution of a crystalline form followed by removal of solvent under conditions in which stable crystals are not formed. For example, solidification can occur by rapid removal of solvent, by rapid addition of an anti-solvent (causing the amorphous form to precipitate out of solution), or by physical interruption of the crystallization process. Grinding processes can also be used. In other embodiments, an amorphous form of a compound of Formula (I), or a pharmaceutically acceptable salt, solvate, or hydrate thereof, can be made using a process or procedure described herein elsewhere.
In certain embodiments, an amorphous form can be obtained by fast cooling from a single solvent system, such as, e.g., ethanol, isopropyl alcohol, t-amyl alcohol, n-butanol, methanol, acetone, ethyl acetate, or acetic acid. In certain embodiments, an amorphous form can be obtained by slow cooling from a single solvent system, such as, e.g., ethanol, isopropyl alcohol, t-amyl alcohol, or ethyl acetate.
In certain embodiments, an amorphous form can be obtained by fast cooling from a binary solvent system, for example, with acetone or DME as the primary solvent. In certain embodiments, an amorphous form can be obtained by slow cooling from a binary solvent system, for example, with ethanol, isopropyl alcohol, THF, acetone, or methanol as the primary solvent. In some embodiments, an amorphous form can be obtained by dissolution of a compound of Formula (I) in t-butanol and water at elevated temperature, followed by cooling procedures to afford an amorphous solid form.
Salt Forms
In certain embodiments, a compound of Formula (I) provided herein is a pharmaceutically acceptable salt, or a solvate or hydrate thereof. In one embodiment, pharmaceutically acceptable acid addition salts of a compound provided herein can be formed with inorganic acids and organic acids. Inorganic acids from which salts can be derived include, but are not limited to, hydrochloric acid, hydrobromic acid, sulfuric acid, nitric acid, phosphoric acid, and the like. Organic acids from which salts can be derived include, but are not limited to, acetic acid, propionic acid, glycolic acid, pyruvic acid, oxalic acid, maleic acid, malonic acid, succinic acid, fumaric acid, tartaric acid, citric acid, benzoic acid, cinnamic acid, mandelic acid, methanesulfonic acid, ethanesulfonic acid, p-toluenesulfonic acid, salicylic acid, and the like. In other embodiments, if applicable, pharmaceutically acceptable base addition salts of a compound provided herein can be formed with inorganic and organic bases. Inorganic bases from which salts can be derived include, but are not limited to, sodium, potassium, lithium, ammonium, calcium, magnesium, iron, zinc, copper, manganese, aluminum, and the like. Organic bases from which salts can be derived include, but are not limited to, primary, secondary, and tertiary amines, substituted amines including naturally occurring substituted amines, cyclic amines, basic ion exchange resins, and the like. Exemplary bases include, but are not limited to, isopropylamine, trimethylamine, diethylamine, triethylamine, tripropylamine, and ethanolamine. In some embodiments, a pharmaceutically acceptable base addition salt is ammonium, potassium, sodium, calcium, or magnesium salt. In one embodiment, bis salts (i.e., two counterions) and higher salts (e.g., three or more counterions) are encompassed within the meaning of pharmaceutically acceptable salts.
In certain embodiments, salts of a compound of Formula (I) can be formed with, e.g., L-tartaric acid, p-toluenesulfonic acid, D-glucaronic acid, ethane-1,2-disulfonic acid (EDSA), 2-naphthalenesulfonic acid (NSA), hydrochloric acid (HCl) (mono and bis), hydrobromic acid (HBr), citric acid, naphthalene-1,5-disulfonic acid (NDSA), DL-mandelic acid, fumaric acid, sulfuric acid, maleic acid, methanesulfonic acid (MSA), benzenesulfonic acid (BSA), ethanesulfonic acid (ESA), L-malic acid, phosphoric acid, and aminoethanesulfonic acid (taurine).
(R)- and (S)-isomers
In some embodiments, the (R)- and (S)-isomers of the non-limiting exemplary compounds, if present, can be resolved by methods known to those skilled in the art, for example by formation of diastereoisomeric salts or complexes which can be separated, for example, by crystallization; via formation of diastereoisomeric derivatives which can be separated, for example, by crystallization, gas-liquid or liquid chromatography; selective reaction of one enantiomer with an enantiomer-specific reagent, for example enzymatic oxidation or reduction, followed by separation of the modified and unmodified enantiomers; or gas-liquid or liquid chromatography in a chiral environment, for example on a chiral support, such as silica with a bound chiral ligand or in the presence of a chiral solvent. Alternatively, a specific enantiomer can be synthesized by asymmetric synthesis using optically active reagents, substrates, catalysts or solvents, or by converting one enantiomer to the other by asymmetric transformation.
XRPD
Compounds and polymorphs provided herein can be characterized by X-ray powder diffraction patterns (XRPD). The relative intensities of XRPD peaks can vary depending upon the sample preparation technique, the sample mounting procedure and the particular instrument employed, among other parameters. Moreover, instrument variation and other factors can affect the 2θ peak values. Therefore, in certain embodiments, the XRPD peak assignments can vary by plus or minus about 0.2 degrees theta or more, herein referred to as “(±0.2°)”.
XRPD patterns for each of Forms A-J and amorphous form of the compound of Formula (I) were collected with a PANalytical CubiX XPert PRO MPD diffractometer using an incident beam of CU radiation produced using an Optix long, fine-focus source. An elliptically graded multilayer mirror was used to focus Cu Kα X-rays through the specimen and onto the detector. Samples were placed on Si zero-return ultra-micro sample holders. Analysis was performed using a 10 mm irradiated width and the following parameters were set within the hardware/software:
| X-ray tube: | Cu Kα, 45 kV, 40 mA | ||
| Detector: | X′Celerator | ||
| Slits: | ASS Primary Slit: Fixed 1° | ||
| Divergence Slit (Prog): | Automatic – 5 mm irradiated length | ||
| Soller Slits: | 0.02 radian | ||
| Scatter Slit (PASS): | Automatic – 5 mm observed length | ||
| Scanning | |||
| Scan Range: | 3.0-45.0° | ||
| Scan Mode: | Continuous | ||
| Step Size: | 0.03° | ||
| Time per Step: | 10 s | ||
| Active Length: | 2.54° | ||
DSC
Compounds and polymorphs provided herein can be characterized by a characteristic differential scanning calorimeter (DSC) thermogram. For DSC, it is known in the art that the peak temperatures observed will depend upon the rate of temperature change, the sample preparation technique, and the particular instrument employed, among other parameters. Thus, the peak values in the DSC thermograms reported herein can vary by plus or minus about 2° C., plus or minus about 3° C., plus or minus about 4° C., plus or minus about 5° C., plus or minus about 6° C., to plus or minus about 7° C., or more. For some polymorph Forms, DSC analysis was performed on more than one sample which illustrates the known variability in peak position, for example, due to the factors mentioned above. The observed peak positional differences are in keeping with expectation by those skilled in the art as indicative of different samples of a single polymorph Form of a compound of Formula (I).
Impurities in a sample can also affect the peaks observed in any given DSC thermogram. In some embodiments, one or more chemical entities that are not the polymorph of a compound of Formula (I) in a sample being analyzed by DSC can result in one or more peaks at lower temperature than peak(s) associated with the transition temperature of a given polymorph as disclosed herein.
DSC analyses were performed using a Mettler 822e differential scanning calorimeter. Samples were weighed in an aluminum pan, covered with a pierced lid, and then crimped. General analysis conditions were about 30° C. to about 300° C.-about 350° C. ramped at about 10° C./min. Several additional ramp rates were utilized as part of the investigation into the high melt Form B, including about 2° C./min, about 5° C./min, and about 20° C./min. Samples were analyzed at multiple ramp rates to measure thermal and kinetic transitions observed.
Isothermal holding experiments were also performed utilizing the DSC. Samples were ramped at about 10° C./min to temperature (about 100° C. to about 250° C.) and held for about five minutes at temperature before rapid cooling to room temperature. In these cases, samples were then analyzed by XRPD or reanalyzed by DSC analysis.
TGA
A polymorphic form provided herein can give rise to thermal behavior different from that of an amorphous material or another polymorphic form. Thermal behavior can be measured in the laboratory by thermogravimetric analysis (TGA) which can be used to distinguish some polymorphic forms from others. In one embodiment, a polymorph as disclosed herein can be characterized by thermogravimetric analysis.
TGA analyses were performed using a Mettler 851e SDTA/TGA thermal gravimetric analyzer. Samples were weighed in an alumina crucible and analyzed from about 30° C. to about 230° C. and at a ramp rate of about 10° C./min.
DVS
Compounds and polymorphs provided herein can be characterized by moisture sorption analysis. This analysis was performed using a Hiden IGAsorp Moisture Sorption instrument. Moisture sorption experiments were carried out at about 25° C. by performing an adsorption scan from about 40% to about 90% RH in steps of about 10% RH and a desorption scan from about 85% to about 0% RH in steps of about −10% RH. A second adsorption scan from about 10% to about 40% RH was performed to determine the moisture uptake from a drying state to the starting humidity. Samples were allowed to equilibrate for about four hours at each point or until an asymptotic weight was reached. After the isothermal sorption scan, samples were dried for about one hour at elevated temperature (about 60° C.) to obtain the dry weight. XRPD analysis on the material following moisture sorption was performed to determine the solid form.
Optical Microscopy
Compounds and polymorphs provided herein can be characterized by microscopy, such as optical microscopy. Optical microscopy analysis was performed using a Leica DMRB Polarized Microscope. Samples were examined with a polarized light microscope combined with a digital camera (1600×1200 resolution). Small amounts of samples were dispersed in mineral oil on a glass slide with cover slips and viewed with 100× magnification.
Karl Fischer Analysis
Compounds and polymorphs provided herein can be characterized by Karl Fischer analysis to determine water content. Karl Fischer analysis was performed using a Metrohm 756 KF Coulometer. Karl Fisher titration was performed by adding sufficient material to obtain 50 μg of water, about 10 to about 50 mg of sample, to AD coulomat.
Raman Spectroscopy
Compounds and polymorphs provided herein can be characterized by Raman spectroscopy. Raman spectroscopy analysis was performed using a Kaiser RamanRXN1 instrument with the samples in a glass well. Raman spectra were collected using a PhAT macroscope at about 785 nm irradiation frequency and about 1.2 mm spot size. Samples were analyzed using 12 to 16 accumulations with about 0.5 to about 12 second exposure time and utilized cosmic ray filtering. The data was processed by background subtraction of an empty well collected with the same conditions. A baseline correction and smoothing was performed to obtain interpretable data when necessary.
FT-IR
Compounds and polymorphs provided herein can be characterized by FT-IR spectroscopy. FT-IR spectroscopy was performed using either a Nicolet Nexus 470 or Avatar 370 Infrared Spectrometer and the OMNIC software. Samples were analyzed using a diamond Attenuated Total Reflection (ATR) accessory. A compound sample was applied to the diamond crystal surface and the ATR knob was turned to apply the appropriate pressure. The spectrum was then acquired and analyzed using the OMNIC software. Alternative sample preparations include solution cells, mulls, thin films, and pressed discs, such as those made of KBr, as known in the art.
NMR
Compounds and polymorphs provided herein can be characterized by nuclear magnetic resonance (NMR). NMR spectra were obtained using a 500 MHz Bruker AVANCE with 5-mm BBO probe instrument. Samples (approximately 2 to approximately 10 mg) were dissolved in DMSO-d6 with 0.05% tetramethylsilane (TMS) for internal reference. 1H-NMR spectra were acquired at 500 MHz using 5 mm broadband observe (1H-X) Z gradient probe. A 30 degree pulse with 20 ppm spectral width, 1.0 s repetition rate, and 32-64 transients were utilized in acquiring the spectra.
High-Performance Liquid Chromatography
Compounds and polymorphs provided herein can be analyzed by high-performance liquid chromatography using an Agilent 1100 instrument. The instrument parameters for achiral HPLC are as follows:
| Column: | Sunfire C18 4.6 × 150 mm | ||
| Column Temperature: | Ambient | ||
| Auto-sampler Temperature: | Ambient | ||
| Detection: | UV at 250 nm | ||
| Mobile Phase A: | 0.05% trifluoroacetic acid in water | ||
| Mobile Phase B: | 0.05% trifluoroacetic acid in MeCN | ||
| Flow Rate: | 1.0 mL/minute | ||
| Injection Volume: | 10 μL | ||
| Data Collection time: | 20 minutes | ||
| Re-equilibration Time: | 5 minutes | ||
| Diluent & Needle Wash: | MeOH | ||
Gradient Conditions:
| Time (minutes) | % A | % B |
| 0.0 | 90 | 10 |
| 3.5 | 90 | 10 |
| 10.0 | 10 | 90 |
| 15.0 | 10 | 90 |
| 18.0 | 90 | 10 |
| 20.0 | 90 | 10 |
Compounds and polymorphs provided herein can be analyzed by high-performance liquid chromatography using a chiral HPLC column to determine % ee values:
| Column: | Chiralpak IC, 4.6 mm × 250 mm, 5 μm. |
| Column Temperature: | Room Temperature |
| Sample Temperature: | Room Temperature |
| Detection: | UV at 254 nm |
| Mobile Phase A: | 60% Hexane 40% (IPA: EtOH = 2:3) with 0.2% |
| Acetic Acid and 0.1% DEA | |
| Isocratic: | 100% A |
| Flow Rate: | 1 mL/min |
| Diluent: | Methanol |
| Injection Volume: | 10 μL |
| Analysis Time: | 25 min |
Example 8
Analytical Data of (S)-3-(1-(9H-purin-6-ylamino)ethyl)-8-chloro-2-phenylisoquinolin-1(2H)-one
Provided herein are analytical data of various purified samples of (S)-3-(1-(9H-purin-6-ylamino)ethyl)-8-chloro-2-phenylisoquinolin-1(2H)-one, the compound of Formula (I). Confirmation of the structure of the compound of Formula (I) was obtained via single crystal X-ray diffraction, FT-IR, 1H-NMR and 13C-NMR spectra.
A single crystal structure of a tert-butyl methyl ether solvate of (S)-3-(1-(9H-purin-6-ylamino)ethyl)-8-chloro-2-phenylisoquinolin-1(2H)-one (e.g., polymorph Form G) was generated and single crystal X-ray data was collected. The structure is shown in FIG. 26, which further confirmed the absolute stereochemistry as the S-enantiomer.
FT-IR spectra of Form C of (S)-3-(1-(9H-purin-6-ylamino)ethyl)-8-chloro-2-phenylisoquinolin-1(2H)-one was obtained, and shown in FIG. 27.
1H-NMR and 13C-NMR spectra of a sample of Form C of (S)-3-(1-(9H-purin-6-ylamino)ethyl)-8-chloro-2-phenylisoquinolin-1(2H)-one were obtained, and are provided in FIG. 28 and FIG. 29, respectively.
Example 9
General Methods for the Preparation of Polymorphs Form A, B, C, D, E, F, G, H, I, J of the Compound of Formula (I)
General Method A: Single Solvent Crystallization with Fast Cooling or Slow Cooling
A sample of a compound of Formula (I) (e.g., Form A or Form C) is placed into a vial equipped with stir bar and dissolved with a minimal amount of solvent (such as about 0.2 mL to about 0.3 mL) at an elevated temperature. The resulting solution is polish filtered through a 0.45 μm syringe filter into a clean preheated vial. After hot filtration, the vial is placed in a refrigerator (e.g., about 4° C.) overnight in a fast cooling procedure, or cooled to ambient temperature at a rate of about 20° C./h and allowed to equilibrate without stiffing at ambient temperature overnight in a slow cooling procedure. Optionally, a sample without solids can be scratched with an implement known in the art (e.g., a spatula) to initiate crystallization. The solution can be allowed to equilibrate for a period of time, such as approximately 8 hours. For a slow cooling sample, if scratching does not provide solids after about 8 hours, then a stir bar can be added and the sample then stirred overnight. A sample without precipitation can be evaporated to dryness under a gentle gas stream, such as argon, nitrogen, ambient air, etc. The precipitated solids can be recovered by vacuum filtration, centrifuge filtration, or decanted as appropriate to afford the Form as indicated below.
General Method B: Multi-Solvent Crystallization with Fast Cooling or Slow Cooling
Multi-solvent (e.g., binary) solvent crystallizations can be performed. Primary solvents include, but are not limited to, ethanol, isopropyl alcohol, methanol, tetrahydrofuran, acetone, methyl ethyl ketone, dioxane, NMP, DME, and DMF. Anti-solvents include, but are not limited to, MTBE, DCM, toluene, heptane, and water.
A sample of a compound of Formula (I) (e.g., Form A or Form C) is placed into a vial equipped with stir bar and dissolved with a minimal amount of solvent (such as about 0.2 mL to about 0.3 mL) at an elevated temperature. The resulting solution is polish filtered through a 0.45 μm syringe filter into a clean preheated vial. After hot filtration, the anti-solvent is added until turbidity is observed. After hot filtration, the vial is placed in a refrigerator (e.g., about 4° C.) overnight in a fast cooling procedure, or cooled to ambient temperature at a rate of about 20° C./h and allowed to equilibrate without stirring at ambient temperature overnight in a slow cooling procedure. Optionally, a sample without solids can be scratched with an implement known in the art (e.g., a spatula) to initiate crystallization. The solution can be allowed to equilibrate for a period of time, such as approximately 8 hours. For a slow cooling sample, if scratching does not provide solids after about 8 hours, then a stir bar can be added and the sample then stirred overnight. A sample without precipitation can be evaporated to dryness under a gentle gas stream, such as argon, nitrogen, ambient air, etc. The precipitated solids can be recovered by vacuum filtration, centrifuge filtration, or decanted as appropriate to afford the Form as indicated below.
General Method C: Slurry Procedures to Afford Formula (I) Polymorph Forms
A mixture of one or more Forms (e.g., Form A or Form C) of the compound of Formula (I) are placed in a vial equipped with a stir bar. A minimal amount of solvent (e.g., a single solvent or a mixture/solution of two or more solvents) is added to the vial to form a heterogeneous slurry. Optionally, the vial can be sealed to prevent evaporation. The slurry is stirred for a period of time ranging from less than about an hour, to about 6 hours, to about 12 hours, to about 24 hours, to about 2 days, to about 4 days, to about 1 week, to about 1.5 weeks, to about 2 weeks or longer. Aliquots can be taken during the stirring period to assess the Form of the solids using, for example, XRPD analysis. Optionally, additional solvent(s) can be added during the stirring period. Optionally, seeds of a given polymorph Form of the compound of Formula (I) can be added. In some cases, the slurry is then stirred for a further period of time, ranging as recited above. The recovered solids can be recovered by vacuum filtration, centrifuge filtration, or decanted as appropriate to afford the Form as indicated below.
Example 10
Preparation of Polymorphs Form A, B, C, D, E, F, G, H, I, J of the Compound of Formula (I)
Form A
Single Solvent Crystallizations to Afford Formula (I) Form A
1. Fast Cooling Procedure From MeCN: Approximately 23 mg of Formula (I) Form A was placed into a 20-mL glass vial equipped with a stir bar. To the vial was added a minimal amount of acetonitrile (7.4 ml) to just dissolve the solids at 70° C. The resulting solution was polish filtered through a 0.45 μm syringe filter into a clean preheated vial. After hot filtration, the vial was placed in a refrigerator (4° C.) overnight. Once at 4° C., the contents of the vial were periodically scratched with a spatula to induce crystallization, and then allowed to equilibrate for approximately 8 hours. The crystals were collected by decanting off the liquid and dried under vacuum (30 inches Hg) at ambient temperature overnight. The dried solids were evaluated for crystallinity and form by XRPD which indicated the crystalline material was polymorph Form A.
2. Slow Cooling Procedure From MeCN: Approximately 24 mg of Formula (I) Form A was placed into a 20-mL glass vial equipped with a stir bar. To the vial was added a minimal amount of acetonitrile (8 ml) to just dissolve the solids at 70° C. The resulting solution was polish filtered through a 0.45 μm syringe filter into a clean preheated vial. After hot filtration, the vial was cooled to ambient temperature at a rate of 20° C./h and allowed to equilibrate without stirring at ambient temperature overnight. After the equilibration hold at ambient temperature, the contents of the vial were periodically scratched with a spatula to induce crystallization, and then allowed to equilibrate for approximately 8 hours. The crystals were collected by decanting off the liquids and dried under vacuum (30 inches Hg) at ambient temperature overnight. The dried solids were evaluated for crystallinity and form by XRPD which indicated the crystalline material was polymorph Form A.
3. Slow Cooling Procedure From n-Butanol: Approximately 23 mg of Formula (I) Form A was placed into a 2-dram glass vial equipped with a stir bar. To the vial was added a minimal amount of n-butanol (0.6 ml) to just dissolve the solids at 70° C. The resulting solution was polish filtered through a 0.45 μm syringe filter into a clean preheated vial. After hot filtration, the vials were cooled to ambient temperature at a rate of 20° C./h and allowed to equilibrate without stirring at ambient temperature overnight. After the equilibration hold at ambient temperature, the contents of the vial were periodically scratched with a spatula to induce crystallization, and then allowed to equilibrate for approximately 8 hours. To further induce crystallization, a stir bar was added to the vial and the contents stirred overnight. The resulting crystals were collected by filtration and dried under vacuum (30 inches Hg) at ambient temperature overnight. The dried solids were evaluated for crystallinity and form by XRPD which indicated the crystalline material was polymorph Form A.
Binary Solvent Crystallizations to Afford Formula (I) Form A
1. Fast Cooling Procedure From Acetone/DCM: Approximately 23.5 mg of Formula (I) Form A was placed into a 2-dram glass vial equipped with a stir bar. To the vial was added a minimal amount of acetone (2.6 ml) to just dissolve the solids at 50° C. The resulting solution was polish filtered through a 0.45 μm syringe filter into a clean preheated vial. After hot filtration, DCM (5.0 ml) was added portion-wise. After the anti-solvent addition, the vials were placed in a refrigerator (4° C.) overnight. Once at 4° C., the contents of the vial were periodically scratched with a spatula to induce crystallization, and then allowed to equilibrate for approximately 8 hours. The crystals were collected by filtration and dried under vacuum (30 inches Hg) at ambient temperature overnight. The dried solids were evaluated for crystallinity and form by XRPD which indicated the crystalline material was polymorph Form A.
2. Fast Cooling Procedure From MEK/DCM: Approximately 23 mg of Formula (I) Form A was placed into a 2-dram glass vial equipped with a stir bar. To the vial was added a minimal amount of MEK (2.2 ml) to just dissolve the solids at 70° C. The resulting solution was polish filtered through a 0.45 μm syringe filter into a clean preheated vial. After hot filtration, DCM (5.0 ml) was added portion-wise. After the anti-solvent addition, the vial was placed in a refrigerator (4° C.) overnight. Once at 4° C., the contents of the vial were periodically scratched with a spatula to induce crystallization, and then allowed to equilibrate for approximately 8 hours. The crystals were collected by filtration and dried under vacuum (30 inches Hg) at ambient temperature overnight. The dried solids were evaluated for crystallinity and form by XRPD which indicated the crystalline material was polymorph Form A.
3. Fast Cooling Procedure From DMF/DCM: Approximately 24 mg of Formula (I) Form A was placed into a 2-dram glass vial equipped with a stir bar. To the vial was added a minimal amount of DCM (0.2 ml) to just dissolve the solids at 70° C. The resulting solution was polish filtered through a 0.45 μm syringe filter into a clean preheated vial. After hot filtration, DCM (7.0 ml) was added portion-wise. After the anti-solvent addition, the vial was placed in a refrigerator (4° C.) overnight. Once at 4° C., the contents of the vial were periodically scratched with a spatula to induce crystallization, and then allowed to equilibrate for approximately 8 hours. The crystals were collected by filtration and dried under vacuum (30 inches Hg) at ambient temperature overnight. The dried solids were evaluated for crystallinity and form by XRPD which indicated the crystalline material was polymorph Form A.
4. Fast Cooling Procedure From Dioxane/DCM: Approximately 24.4 mg of Formula (I) Form A was placed into a 2-dram glass vial equipped with a stir bar. To the vial was added a minimal amount of dioxane (0.8 ml) to just dissolve the solids at 70° C. The resulting solution was polish filtered through a 0.45 μm syringe filter into a clean preheated vial. After hot filtration, DCM (7.0 ml) was added portion-wise. After the anti-solvent addition, the vial was placed in a refrigerator (4° C.) overnight. Once at 4° C., the contents of the vial were periodically scratched with a spatula to induce crystallization, and then allowed to equilibrate for approximately 8 hours. The crystals were collected by filtration and dried under vacuum (30 inches Hg) at ambient temperature overnight. The dried solids were evaluated for crystallinity and form by XRPD which indicated the crystalline material was polymorph Form A.
5. Slow Cooling Procedure From Acetone/DCM: Approximately 22 mg of Formula (I) Form A was placed into a 2-dram glass vial equipped with a stir bar. To the vial was added a minimal amount of acetone (2.5 ml) to just dissolve the solids at 50° C. The resulting solution was polish filtered through a 0.45 μm syringe filter into a clean preheated vial. After hot filtration, DCM (5.0 ml) was added portion-wise. After the anti-solvent addition, the vial was cooled to ambient temperature at a rate of 20° C./h and allowed to equilibrate without stirring at ambient temperature overnight. After the equilibration hold at ambient temperature, the contents of the vial were periodically scratched with a spatula to induce crystallization, and then allowed to equilibrate for approximately 8 hours. To further induce crystallization, a stir bar was added to the vial and the contents stirred overnight. The resulting crystals were collected by filtration and dried under vacuum (30 inches Hg) at ambient temperature overnight. The dried solids were evaluated for crystallinity and form by XRPD which indicated the crystalline material was polymorph Form A.
6. Slow Cooling Procedure From MEK/DCM: Approximately 23.4 mg of Formula (I) Form A was placed into a 2-dram glass vial equipped with a stir bar. To the vial was added a minimal amount of MEK (2.2 ml) to just dissolve the solids at 70° C. The resulting solution was polish filtered through a 0.45 μm syringe filter into a clean preheated vial. After hot filtration, DCM (5.0 ml) was added portion-wise. After the anti-solvent addition, the vial was cooled to ambient temperature at a rate of 20° C./h and allowed to equilibrate without stirring at ambient temperature overnight. After the equilibration hold at ambient temperature, the contents of the vial were periodically scratched with a spatula to induce crystallization, and then allowed to equilibrate for approximately 8 hours. The resulting crystals were collected by filtration and dried under vacuum (30 inches Hg) at ambient temperature overnight. The dried solids were evaluated for crystallinity and form by XRPD which indicated the crystalline material was polymorph Form A.
7. Slow Cooling Procedure From Dioxane/DCM: Approximately 24 mg of Formula (I) Form A was placed into a 2-dram glass vial equipped with a stir bar. To the vial was added a minimal amount of dioxane (0.8 ml) to just dissolve the solids at 70° C. The resulting solution was polish filtered through a 0.45 μm syringe filter into a clean preheated vial. After hot filtration, DCM (7.0 ml) was added portion-wise. After the anti-solvent addition, the vial was cooled to ambient temperature at a rate of 20° C./h and allowed to equilibrate without stirring at ambient temperature overnight. After the equilibration hold at ambient temperature, the contents of the vial were periodically scratched with a spatula to induce crystallization, and then allowed to equilibrate for approximately 8 hours. To further induce crystallization, a stir bar was added to the vial and the contents stirred overnight. The resulting crystals were collected by filtration and dried under vacuum (30 inches Hg) at ambient temperature overnight. The dried solids were evaluated for crystallinity and form by XRPD which indicated the crystalline material was polymorph Form A.
8. Slow Cooling Procedure From DMF/DCM: Approximately 23.5 mg of Formula (I) Form A was placed into a 2-dram glass vial equipped with a stir bar. To the vial was added a minimal amount of DMF (0.2 ml) to just dissolve the solids at 70° C. The resulting solution was polish filtered through a 0.45 μm syringe filter into a clean preheated vial. After hot filtration, DCM (7.0 ml) was added portion-wise. After the anti-solvent addition, the vial was cooled to ambient temperature at a rate of 20° C./h and allowed to equilibrate without stirring at ambient temperature overnight. After the equilibration hold at ambient temperature, the contents of the vial were periodically scratched with a spatula to induce crystallization, and then allowed to equilibrate for approximately 8 hours. To further induce crystallization, a stir bar was added to the vial and the contents stirred overnight. To further induce crystallization, the contents of the vial were concentrated under a gentle stream of nitrogen to near dryness. The resulting crystals were collected by filtration and dried under vacuum (30 inches Hg) at ambient temperature overnight. The dried solids were evaluated for crystallinity and form by XRPD which indicated the crystalline material was polymorph Form A.
Slurry Procedure to Afford Formula (I) Form A
1. Procedure from CH2Cl2 and from IPA: Form C (1 g) was slurried in five volumes of dichloromethane. After holding for 15 hours, filtration, and drying, Form A was isolated in 82% yield. Scale-up was performed on a 20 g scale with a water-wet cake of Form C to yield Form A in 92% yield. Drying at 70° C. for six days indicated no degradation in chemical or chiral purity. Slurrying dry Form C in isopropyl alcohol using a similar method also yielded Form A.
2. Procedure for Competitive Slurry Experiment (using forms A, B and C): Competitive slurries were performed by charging approximately a 50/50 mixture of Forms A and C (11.2 mg of Form A and 11.7 mg Form C) to a 1-dram glass vial equipped with a glass stir bar. To the vial was added 600 μL of MeCN. The vial cap was wrapped with parafilm to prevent evaporation. The slurry was stirred for 1 day and an aliquot was taken. The contents of the vial were allowed to stir for an additional week and another aliquot was taken. Both aliquots were centrifuge filtered for five minutes at 8000 RPM. XRPD analysis was performed on the solids from each aliquot to show that the Formula (I) had converted to Form A at both time points. After the one week aliquot was taken, an additional 300 μL of acetonitrile was added to the remaining slurry and allowed to equilibrate for one day. The slurry was then seeded with approximately 3.2 mg of Form B and allowed to equilibrate for an additional three days. The solids were isolated by centrifuge filtration (5 minutes at 8000 RPM) and dried over night under vacuum. The dried solids were evaluated for crystallinity and form by XRPD which indicated the crystalline material was polymorph Form A.
3. Procedure for Competitive Slurry Experiment (using forms A, C, D, and E): Competitive slurries were performed by charging an approximately equal mixture of each form (7.8 mg of Form A, 7.7 mg Form C, 7.7 mg of Form D, and 8.2 mg of Form E) to a 1-dram glass vial equipped with a glass stir bar. To the vial was added 1 ml of 2-propanol. The vial cap was wrapped with parafilm to prevent evaporation. The slurry was mixed for 1 day and an aliquot was taken. The contents of the vial were allowed to stir for an additional week and another aliquot was taken. Both aliquots were centrifuge filtered for five minutes at 8000 RPM. XRPD analysis was performed on the solids from each aliquot to show that the Formula (I) had converted to Form A at both time points. After the one week aliquot was taken, the remaining solids were isolated by centrifuge filtration (5 minutes at 8000 RPM) and dried over night under vacuum. The dried solids were evaluated for crystallinity and form by XRPD which indicated the crystalline material was polymorph Form A.
Using the General Method B of Example 9, the following experiments detailed in Tables 4 and 5 were performed to afford Formula (I) Form C. Table 4 experiments were conducted using the fast cooling procedure, while Table 5 experiments were conducted using the slow cooling procedure.
Table 4. Fast Cooling Procedure

Table 5. Slow Cooling Procedure

Using General Method C of Example 9, the following experiments detailed in Table 6 were performed to afford the polymorph Form of the compound of Formula (I) as indicated.
Table 6:

Example 12
XRPD Studies
[00653] Using the XRPD instrument and parameters described above, the following XRPD peaks were observed for Formula (I) Polymorph Forms A, B, C, D. E, F, G, H, I, and J. The XRPD traces for these ten polymorph forms are given in Figures 1-10, respectively. In Table 7, peak position units are °2Θ. In one embodiment, a given polymorph Form can be characterized as having at least one of the five XRPD peaks given in Set 1 in Table 7. In another embodiment, the given Form can be characterized as having at least one of the five XRPD peaks given in Set 1 in combination with at least one of the XRPD peaks given in Set 2 in Table 7. In some embodiments, one or more peak position values can be defined as being modified by the term “about” as described herein. In other embodiments, any given peak position is with ±0.2 2Θ (e.g., 9.6+0.2 2Θ).
Table 7.

Example 13
Differential Scanning Calorimetry (DSC) Studies
[00654] Using the DSC instrument and parameters described above, the following DSC peaks were observed for the compound of Formula (I) polymorph Forms A, B, C, D. E, F, G, H, I, and J. The DSC thermograms for these nine polymorph forms are given in FIGS. 12-24, respectively, and peak positions are given in Table 8. Further DSC data for Polymorph Forms A, B, C, D. E, F, G, H, I, and J is given in Table 9 below. Unless marked with a Λ that indicates an exothermic peak, all peaks are endothermic.
Table 8.

Table 9 summarizes non-limiting exemplary preparation techniques for Formula (I) Polymorph Forms A-J and representative analytical data as described below and elsewhere.
Table 9.


http://www.google.com/patents/US8809349?cl=en
Extras…….
SEE NMR ……….http://www.medkoo.com/Product-Data/IPI-145/IPI-145-QC-SSC20130422Web.pdf
http://www.chemietek.com/Files/Line2/CHEMIETEK,%20IPI-145%20(01),%20NMR.pdf

Necessity of Establishing Chemical Integrity of Polymorphs of Drug Substance Using a Combination of NMR, HPLC, Elemental Analysis, and Solid-State Characterization Techniques: Case Studies

Necessity of Establishing Chemical Integrity of Polymorphs of Drug Substance Using a Combination of NMR, HPLC, Elemental Analysis, and Solid-State Characterization Techniques: Case Studies
Cocrystals of telmisartan: characterization, structure elucidation, in vivo and toxicity studies
Cocrystals of telmisartan: characterization, structure elucidation, in vivo and toxicity studies
DOI: 10.1039/C4CE00797B, Paper
Tel: +91 9316015096
Tel: +91 9779932606
![[1 with combining macron]](https://i0.wp.com/www.rsc.org/images/entities/char_0031_0304.gif) space groups, respectively. The improved solubility of telmisartan–saccharin (TEL–SAC) (nine-fold) and telmisartan–glutaric acid (two-fold) cocrystals in comparison with the free drug has been demonstrated in solubility experiments in phosphate buffer, pH 7.5. The TEL–SAC cocrystal remained stable in the aqueous medium for 6 hours as confirmed by PXRD. The AUC0–24 of TEL–SAC and TEL–GA was found to be 2-fold and 1.4-fold increased in terms of bioavailability than pure TEL, respectively. The in vivo antihypertensive activity of TEL–SAC in DOCA salt-induced hypertensive rats showed two-fold improved efficacy, while acute toxicity studies revealed no signs of toxicity in rats even at doses of 2000 mg kg−1 of body weight (BW). The new solid phase of telmisartan with saccharin represents a promising and viable opportunity for the manufacture of a drug product with improved therapeutic outcomes.
space groups, respectively. The improved solubility of telmisartan–saccharin (TEL–SAC) (nine-fold) and telmisartan–glutaric acid (two-fold) cocrystals in comparison with the free drug has been demonstrated in solubility experiments in phosphate buffer, pH 7.5. The TEL–SAC cocrystal remained stable in the aqueous medium for 6 hours as confirmed by PXRD. The AUC0–24 of TEL–SAC and TEL–GA was found to be 2-fold and 1.4-fold increased in terms of bioavailability than pure TEL, respectively. The in vivo antihypertensive activity of TEL–SAC in DOCA salt-induced hypertensive rats showed two-fold improved efficacy, while acute toxicity studies revealed no signs of toxicity in rats even at doses of 2000 mg kg−1 of body weight (BW). The new solid phase of telmisartan with saccharin represents a promising and viable opportunity for the manufacture of a drug product with improved therapeutic outcomes.Structural characterization of form I of anhydrous rifampicin
Structural characterization of form I of anhydrous rifampicin
DOI: 10.1039/C4CE01157K, Paper
New cocrystals of ezetimibe with L-proline and imidazole
New cocrystals of ezetimibe with L-proline and imidazole
DOI: 10.1039/C4CE01127A, Paper
 O, O–HN, N–HO and C–HO hydrogen bonds played an important role in all these crystal structures. EZT-PRO cocrystal showed improved apparent solubility and solid state stability.
Polymorphs and co-crystals of haloprogin: an antifungal agent
 Haloprogin
Haloprogin is a topical antifungal agent. Its structure does not contain any of the functional groups typically exploited in hydrogen bond based co-crystal design. On the other hand, its 1-iodoalkyne moiety is nicely tailored to a crystal engineering strategy based on halogen bonding. Here we describe the formation of three polymorphs of haloprogin and of three co-crystals that this active pharmaceutical ingredient forms with both neutral and ionic co-crystal formers. The halogen bond plays a major role in all of the six structures and the interaction is thus confirmed to be a valuable tool which may complement the hydrogen bond when polymorphs and co-crystals of active pharmaceutical ingredients are pursued.

Graphical abstract: Polymorphs and co-crystals of haloprogin: an antifungal agent
http://pubs.rsc.org/en/Content/ArticleLanding/2014/CE/C4CE00367E?utm_medium=email&utm_campaign=pub-CE-vol-16-issue-26&utm_source=toc-alert#!divAbstract
Polymorphs and co-crystals of haloprogin: an antifungal agent
Michele Baldrighi,a Davide Bartesaghi,a Gabriella Cavallo,a Michele R. Chierotti,b Roberto Gobetto,b Pierangelo Metrangolo,*a Tullio Pilati,a Giuseppe Resnati*a and Giancarlo Terraneo*a
*Corresponding authors
aNFMLab-Laboratory of Nanostructured Fluorinated Materials (NFMLab), Department of Chemistry, Materials, and Chemical Engineering “Giulio Natta”, Politecnico di Milano, Via L. Mancinelli 7, 20131 Milan, Italy
E-mail: pierangelo.metrangolo@polimi.it, giuseppe.resnati@polimi.it, giancarlo.terraneo@polimi.it
bDepartment of Chemistry, Università di Torino, Via P. Giuria 7, 10125 Torino, Italy
CrystEngComm, 2014,16, 5897-5904
DOI: 10.1039/C4CE00367E
EXTRA INFO
| Systematic (IUPAC) name | |
|---|---|
| 1,2,4-trichloro-5-[(3-iodoprop-2-yn-1-yl)oxy]benzene | |
| Clinical data | |
| Legal status | Not available in U.S. |
| Routes | Topical |
| Identifiers | |
| CAS number | 777-11-7 |
| ATC code | D01AE11 |
| PubChem | CID 3561 |
| DrugBank | DB00793 |
| ChemSpider | 3440 |
| UNII | AIU7053OWL |
| KEGG | D00339 |
| ChEMBL | CHEMBL1289 |
| Chemical data | |
| Formula | C9H4Cl3IO |
| Mol. mass | 361.39 g/mol |
| Physical data | |
| Melt. point | 113.5 °C (236 °F) |
| Solubility in water | insoluble mg/mL (20 °C) |
Haloprogin is an antifungal drug used to treat athlete’s foot and other fungal infections. It is marketed in creams under the trade names Halotex, Mycanden, Mycilan, and Polik.
Action
Haloprogin was previously used in 1% topical creams as an antifungal agent. It was marketed over the counter primarily to treat tinea infections of the skin. The mechanism of action is unknown.[1]
Haloprogin had a high incidence of side effects including: irritation, burning, vesiculation (blisters), scaling, and itching. It has since been discontinued due to the emergence of more modern antifungals with fewer side effects.[2]
Haloprogin is used as a topical ointment or cream in the treatment of Tinea infections. Tinea infections are superficial fungal infections caused by three species of fungi collectively known as dermatophytes (Trichophyton, Microsporum and Epidermophyton). Commonly these infections are named for the body part affected, including tinea corporis (general skin), tinea cruris (groin), and tinea pedis (feet). Haloprogin is a halogenated phenolic ether administered topically for dermotaphytic infections. The mechanism of action is unknown, but it is thought to be via inhibition of oxygen uptake and disruption of yeast membrane structure and function. Haloprogin is no longer available in the United States and has been discontinued.
U.S. Patent 3,322,813.

References
- “Haloprogin”. Drugs@FDA. Food and Drug Administration. Retrieved 2007-02-17.
- “Haloprogin”. DrugBank. University of Alberta. Nov 6, 2006. Retrieved 2007-02-17.
Knowledge-based approaches to co-crystal design
Knowledge-based approaches to co-crystal design – CrystEngComm (RSC Publishing) //
Peter A. Wood, Neil Feeder, Matthew Furlow, Peter T. A. Galek, Colin R. Groom and Elna Pidcock
CrystEngComm, 2014, 16, 5839 DOI:10.1039/C4CE00316K
Knowledge-based approaches to co-crystal design – CrystEngComm (RSC Publishing) //
Knowledge-based approaches to co-crystal design
Tel: +44 (0)1223 336408
DOI: 10.1039/C4CE00316K
FDA Guidance on Polymorphic Compounds in Generic Drugs

The guidance issued by the US Food and Drug Administration advises companies on how to treat polymorphic drug compounds—those that exhibit multiple structural forms—in filing abbreviated new drug applications (ANDAs). The bottom line, according to the guidance, is that generic drug products containing the polymorphs be the “same” as the reference listed drug (RLD) in active ingredients, bioavailability, and bioequivalence.
The guidance pertains to orally available drugs that are either solid- or suspension-dosage products.
Polymorphisms arise when compounds are identical chemically, but not structurally. This can happen when two solids take on different crystalline forms—such as graphite and diamond; when molecules are disordered and fail to produce a repeatable crystal lattice, as is the case for the molecules in glass; or when solvent is trapped inside the crystal structure—as in hydrates, where water molecules are found within crystals.
The guidance notes that different polymorphisms may alter physical properties of compounds and affect their solubility, which in turn can alter their bioavailability or bioequivalence. In addition, polymorphic forms of a compound may alter the way the compound behaves during production, which again, may alter the finished drug’s biological activities.
On this latter point, the guidance specifically states, “Since an ANDA applicant should demonstrate that the generic drug product can be manufactured reliably using a validated process, we recommend that you pay close attention to polymorphism as it relates to pharmaceutical processing.”
The guidance also emphasizes the effect polymorphisms may have on drug stability, which again, may alter the drug’s biological activity. But the guidance goes on to say that “it is the stability of the drug product and not stability of the drug substance polymorphic form that should be the most relevant measure of drug equality.” Otherwise, a generic drug can be considered the “same” as the active ingredient in an RLD if the generic compound conforms to the standards set out in a United States Pharmacopeia (USP) monograph, if one exists for that particular drug substance.
These standards generally include the chemical name, empirical formula, and molecular structure of the compound. However, the “FDA may prescribe additional standards that are material to the sameness of a drug substance.” But as concerns polymorphisms, the guidance goes on to say “…differences in drug substance polymorphic forms do not render drug substances different active ingredients for the purposes of ANDA approvals….”
Finally, the guidance reminds ANDA applicants that the biological performance characteristics of a drug are also dependent on the drug’s formulation and advises applicants to consider the properties of both the drug substance and formulation excipients, when assessing “sameness.”
A sponsor of an Abbreviated New Drug Application (ANDA) must have information to show that the proposed generic product and the innovator product are both pharmaceutically equivalent and bioequivalent, and therefore, therapeutically equivalent.
Many pharmaceutical solids exist in several crystalline forms and thus exhibit polymorphism. Polymorphism may result in differences in the physico-chemical properties of the active ingredient and variations in these properties may render a generic drug product to be bioinequivalent to the innovator brand. For this reason, in ANDAs, careful attention is paid to the effect of polymorphism in the context of generic drug product equivalency.
This review ..Adv Drug Deliv Rev. 2004 Feb 23;56(3):397-414……discusses the impact of polymorphism on drug product manufacturability, quality, and performance. Conclusions from this analysis demonstrate that pharmaceutical solid polymorphism has no relevance to the determination of drug substance “sameness” in ANDAs.
Three decision trees for solid oral dosage forms or liquid suspensions are provided for evaluating when and how polymorphs of drug substances should be monitored and controlled in ANDA submissions. Case studies from ANDAs are provided which demonstrate the irrelevance of polymorphism to the determination of drug substance “sameness”. These case studies also illustrate the conceptual framework from these decision trees and illustrate how their general principles are sufficient to assure both the quality and the therapeutic equivalence of marketed generic drug products.
read
ANDAs: Pharmaceutical Solid Polymorphism – Food and Drug … click here
also
Issues of Polymorphism and Abbreviated New Drug Applications click here
and
POLYMORPHISM OF DRUGS – Seventh Street Development Group click here
An Overview of Solid Form Screening During Drug … – ICDD..http://www.icdd.com/ppxrd/10/presentations/PPXRD-10_Ann_Newman.pdf
http://www.ivtnetwork.com/sites/default/files/Polymorphism_01.pdf
Although polymorph/salt screening should ideally be performed to select the optimum solid form upon selection of the lead compound prior to animal pharmacokinetic (PK) studies, these screening study can be costly and time consuming. But the consequences of late discovery of a thermodynamic form are grave, so there must be a strategy to minimize the risk without spending a large amount of resources.
We find this right strategy based on early BCS classification of new compounds. We tailor the upfront polymorph/salt studies based on the risk in bioavailability, stability and manufacture-ability. Since regulatory agencies worldwide require the use of the same salt across preclinical and clinical studies, for insoluble or unstable compounds, salt screening is done early to enable further compound development.
Once salt is selected, the polymorph screening of the selected salt if soluble may be done a little later after animal study. However it is paramount to confirm 1) the polymorph in use is stable in the toxicological vehicle, 2) no changes of solid forms during shipping and storage, 3) no significant degradation upon storage.
Should there be polymorphic changes such as formation of a hydrate in the animal vehicle resulting in lowered solubility and precipitation of the hydrate, or formation of a hydrate when exposed to humidity during shipping and storage, early discovery of the stable forms will enable consistent animal exposure and avoid study repeats and delays in timelines.
Therefore, although most companies do not perform comprehensive polymorph screening until late in the development cycle, we recommend identification of a thermodynamic stable form within the confine of not only the API manufacture processes but also in the designated animal and human formulations.
For instance, for a drug product manufactured by direct compression, the solidstate properties of the active ingredient will likely be critical to the manufacture of the drug product, particularly when it constitutes the bulk of the tablet mass.
On the other hand, for a drug product manufactured by wet granulation, the solidstate properties of the active ingredient may no longer be important but the potential for polymorphic conversion is high in the presence of high moisture contents. In the context of the effect of polymorphism on pharmaceutical processing, what is most relevant is the ability to consistently manufacture a drug product that conforms to applicable in-process controls and release specifications.
This upfront work is especially critical to insoluble compounds prone to varied oral bioavailability in animal and human.
How to Handle Drug Polymorphs… Case Study of Trelagliptin Succinate

PART 1………..http://drugsynthesisint.blogspot.in/p/gliptin-series.html
PART 2 ……http://organicsynthesisinternational.blogspot.in/p/gliptin-series-22.html


If you’re involved in late drug discovery, API manufacture, drug product formulation, clinical material production, or manufacture of final dosage form, a basic understanding and awareness of solid form issues could save you a great deal of difficulty, time, and money during drug development.


Investigational new drug, writing an application for clinical trial authorization, permission marketing …The control of polymorphism in drug candidates is now ubiquitous.
READ………….An Overview of Solid Form Screening During Drug Development, http://www.icdd.com/ppxrd/10/presentations/PPXRD-10_Ann_Newman.pdf
ANN NEWMAN
When addressing the subject of polymorphism, the first reference that comes to mind is that of the occurred during the manufacture of ritonavir incident. Abbott molecule inhibitor of HIV protease marketed as Norvir, is a cautionary example of the challenges of polymorphism.
Indeed, during the production of ritonavir in 1997, a new polymorph unmarked emerged. Its precipitation and unexpected outbreak led to the cessation of the production of Norvir and seriously compromise the process. The incident has deeply marked the pharmaceutical industry.
It is ironic that the process used to discover pharmaceutical drug targets is the same one that decreases the actual efficacy of those drugs once ingested. If you remember from basic chemistry, there are compounds that exist in highly ordered crystalline states and those that remain in amorphous form.
The discovery of drug targets has often been accomplished through X-ray crystallography, which requires a sample (for example, of a defective enzyme linked to cancer or high cholesterol) to be crystallized so that the diffraction patterns can be made sense of. Scientists may spend years trying to crystallize one molecule or compound so that they can identify regions that, for example, may be blocked by pharmaceuticals.
However, when it comes to the molecular arrangement of those pharmaceuticals, crystallization actually decreases their bioavailability and solubility. Thus, it may be better for these drugs to be in amorphous form. Pierric Marchand, general manager of the company Holodiag, dedicated to the study and characterization of solid state, summarizes that ” today, it is not reasonable to not worry about the problem of polymorphism ” .
” In recent years, manufacturers have realized the essential side of expertise , “says Jean-Rémi David, commercial director Calytherm. The services company specializing in the field of physico-chemical analysis, based in Herault, has just relocated last year in supporting pharmaceutical development to meet demand. ” This is a concern for all deal with potential impacts on the effectiveness or the formulation , “says Stéphane Suchet, quality manager in the group of fine and specialty chemicals Axyntis.
Polymorphic forms are the amorphous and crystalline forms such as hydrate or solvate forms. When a molecule of interest exists in polymorphic forms, it is called polymorphism, according to the definition of the FDA (Food and Drug Administration).
Polymorphism is present at all stages of development of a drug from research to marketing. ” Keep in mind that organic molecule loves to polymorphism , “says Marchand Pierric. However, for a marketing authorization for example, must learn the criteria for the polymorphism of the molecule. ” In terms of the formulation, for example we can check whether the selected polymorphism is unchanged , “explains Pierric Marchand.

A significant influence on several levels Because the consequences of polymorphism are multiple. ” They are at three levels: bioequivalence, manufacturability and stability “lists Fabienne Lacoulonche, founder and scientific director of Calytherm.In terms of bioequivalence, different polymorphic forms may have different properties of solubility and dissolution rate … ” For poorly soluble active ingredients, you can have much more bioavailable than other crystalline forms , “Fabienne Lacoulonche information.
In terms of manufacturability, some parameters such as temperature, moisture can lead to changes in the crystalline form. ” The complexity is to anticipate changes polymorphism, both at laboratory scale, pilot and industrial , “adds the founder of Calytherm. Finally, polymorphism plays on stability. Active ingredient or finished product, are subjected to stability studies in this direction. ” When the molecule is identified, we try to highlight the existence of several forms of polymorphism, explains Stéphane Suchet (Axyntis) .
When developing a new substance, the assessment is systematic . ” Isolation of crystals from a screening is carried out in different solvents by various analytical techniques. Ideally, it will be concluded the absence of polymorphism. ” But if different polymorphic forms are present, we rework the terms of our crystallization process to control the formation of the same polymorph reproducibly ideally form the thermodynamically more stable , “says Stéphane Suchet. X-ray diffraction and other thermal analysis ”
The ICH guidelines provide decision trees to guide the industry in controlling polymorphism says Fabienne Lacoulonche (Calytherm.) We use it for writing the CTD (Common Technical Document) .
“Polymorphism is a phenomenon” complex and difficult to control, because the crystallization is dependent on many parameters , she develops. must understand the maximum . ” For this, several analytical methods are available to industry. The main technique is the X-ray diffraction ” It is a robust, rapid, which allows to characterize the different polymorphs , “summarizes Pierric Marchand (Holodiag).Non-destructive, it can work both on small quantities on large samples. Temperature and atmosphere are controlled, and analytical capabilities are broad.

But if this technique indispensable allows for routine and development, it is not sufficient in itself. Just to add a battery of additional tests, thermal analysis. ” It takes coupling methods “ confirms Fabienne Lacoulonche (Calytherm). The X-ray diffraction is a method of choice, but sometimes it is not sufficient.
The coupling with a thermal analysis method (technical ATG, or DSC thermal analysis, differential scanning calorimetry or thermomicroscopique) allows to distinguish between two polymorphic whose RX diffractograms obtained are comparable.
TGA can be coupled with IR or mass spectrometry, DSC with RX. Raman spectroscopy is also part of complementary methods. ” The difficulty increases when we want to characterize the shape of the active ingredient in the finished product , says Fabienne Lacoulonche. example, by X-ray diffraction, the peaks related to the active ingredient in the diffractogram of the finished product may be masked by those excipients: it is then necessary to use other methods, such as Raman microscopy. “In general, a single method of analysis is not sufficient to characterize the polymorphism of an active substance in the active substance or finished product: the complementarity of different methods that will conclude precisely on the polymorphism of a crystalline substance.
In addition, ” the diffractometer remains an expensive device, which requires installation in an air-conditioned and a cooling room , “says Marchand Pierric (Holodiag). To this is added the need to have expertise and qualified personnel to carry out the analyzes. ” We must master these techniques and the ability to interpret the results , “says Jean-Rémi David (Calytherm). However, polymorphism is a “problem well under control , “said Stéphane Suchet (Axyntis),” systematically evaluated although it is however not always immune to miss a polymorphic form, knowing that the screening performed in the development can never be completely comprehensive … ”

FDA
FDA may refuse to approve an ANDA referencing a listed drug if the application contains insufficient information to show that the drug substance is the “same” as that of the reference listed drug. A drug substance in a generic drug product is generally considered to be the same as the drug substance in the reference listed drug if it meets the same standards for identity.
In most cases, the standards for identity are described in the USPalthough FDA may prescribe additional standards when necessary. Because drug product performance depends on the product formulation, the drug substance in a proposed generic drug product need not have the same physical form (particle size, shape, or polymorph form) as the drug substance in the reference listed drug. An ANDA applicant is required to demonstrate that the proposed product meets the standards for identity, exhibits sufficient stability and is bioequivalent to the reference listed drug.
FDA PRESENTATION……polymorphs and co-crystals – ICDD Regulatory Considerations on Pharmaceutical Solids: Polymorphs/Salts and Co-Crystals.. THIS IS A MUST READ ITEM
Over the years FDA has approved many generic drug products based upon a drug substance with different physical form from that of the drug substance in the respective reference listed drug (e.g., warfarin sodium, famotidine, and ranitidine). Also many ANDAs have been approved in which the drug substances differed from those in the corresponding reference listed drugs with respect to solvation or hydration state (e.g., terazosin hydrochloride, ampicillin, and cefadroxil). Several regulatory documents and literature reports (67-69) address issues relevant to the regulation of polymorphism.
The concepts and principles outlined in these are applicable for an ANDA. However, certain additional considerations may be applicable in case of ANDAs. Often at the time FDA receives an ANDA a monograph defining certain key attributes of the drug substance and drug product may be available in the Unites States Pharmacopoeia (USP). These public standards play a significant role in the ANDA regulatory review process and in case of polymorphism, when some differences are noted, lead to additional requirements and considerations.
This commentary is intended to provide a perspective on polymorphism in pharmaceutical solid in the context of ANDAs. It highlights major considerations for monitoring and controlling drug substance polymorphs and describes a framework for regulatory decisions regarding drug substance “sameness” considering the role and impact of polymorphism in pharmaceutical solids.

Since polymorphs exhibit certain differences in physical (e.g., powder flow and compactability, apparent solubility and dissolution rate) and solid state chemistry (reactivity) attributes that relate to stability and bioavailability it is essential that the product development and the FDA review process pay close attention to this issue.
This scrutiny is essential to ensure that polymorphic differences (when present) are addressed via design and control of formulation and process conditions to physical and chemical stability of the product over the intended shelf-life, and bioavailability/bioequivalence.
Most pharmaceuticals are distributed as solid doseages. In order to take action, they must dissolve in the gut and be absorbed into the blood stream. In many cases, the rate at which the drug dissolves can limit its effectiveness. Pharmaceutical compounds can be packed into more than one arrangement in the solid states known as polymorphs. Rapid and efficient methods of polymorph formation can be used to increase drug efficacy and shelf life.
Regulatory agencies worldwide require that, as part of any significant filing, a company has to demonstrate that it has made a reasonable effort to identify the polymorphs of their drug substance and has checked for polymorph interconversions. Due to the unpredictable behaviour of polymorphs and their respective differences in physicochemical properties, companies also have to demonstrate consistency in manufacturing between batches of the same product. Proper understanding of the polymorph landscape and nature of the polymorphs will contribute to manufacturing consistency.
POLYMORPHISM AND PATENTS http://www.collegio.unibo.it/uploads/ideas/joelbernstein.pdf A MUST CLICK FOR PHARMA CHEMISTS

READ………..High-throughput crystallization: polymorphs, salts, co-crystalsand solvates of pharmaceutical solidshttp://citeseerx.ist.psu.edu/viewdoc/download?doi=10.1.1.85.5397&rep=rep1&type=pdf

Definitions
“Crystalline”, as the term is used herein, refers to a material, which may be hydrated and/or solvated, and has sufficient ordering of the chemical moiety to exhibit a discernable diffraction pattern by XRPD or other diffraction techniques. Often, a crystalline material that is obtained by direct crystallization of a compound dissolved in a solution or by interconversion of crystals obtained under different crystallization conditions, will have crystals that contain the solvent used in the crystallization, termed a crystalline solvate. Also, the specific solvent system and physical embodiment in which the crystallization is performed, collectively termed crystallization conditions, may result in the crystalline material having physical and chemical properties that are unique to the crystallization conditions, generally due to the orientation of the chemical moieties of the compound with respect to each other within the crystal and/or the predominance of a specific polymorphic form of the compound in the crystalline material.
Depending upon the polymorphic form(s) of the compound that are present in a composition, various amounts of the compound in an amorphous solid state may also be present, either as a side product of the initial crystallization, and/or a product of degradation of the crystals comprising the crystalline material. Thus, crystalline, as the term is used herein, contemplates that the composition may include amorphous content; the presence of the crystalline material among the amorphous material being detectably among other methods by the composition having a discernable diffraction pattern.
The amorphous content of a crystalline material may be increased by grinding or pulverizing the material, which is evidenced by broadening of diffraction and other spectral lines relative to the crystalline material prior to grinding. Sufficient grinding and/or pulverizing may broaden the lines relative to the crystalline material prior to grinding to the extent that the XRPD or other crystal specific spectrum may become undiscernable, making the material substantially amorphous or quasi-amorphous. Continued grinding would be expected to increase the amorphous content and further broaden the XRPD pattern with the limit of the XRPD pattern being so broadened that it can no longer be discerned above noise. When the XRPD pattern is broadened to the limit of being indiscernible, the material may be considered no longer a crystalline material, but instead be wholly amorphous. For material having increased amorphous content and wholly amorphous material, no peaks should be observed that would indicate grinding produces another form.
“Amorphous“, as the term is used herein, refers to a composition comprising a compound that contains too little crystalline content of the compound to yield a discernable pattern by XRPD or other diffraction techniques. Glassy materials are a type of amorphous material. Glassy materials do not have a true crystal lattice, and technically resembling very viscous non-crystalline liquids. Rather than being true solids, glasses may better be described as quasi-solid amorphous material. “Broad” or “broadened”, as the term is used herein to describe spectral lines, including XRPD, NMR and IR spectroscopy, and Raman spectroscopy lines, is a relative term that relates to the line width of a baseline spectrum. The baseline spectrum is often that of an unmanipulated crystalline form of a specific compound as obtained directly from a given set of physical and chemical conditions, including solvent composition and properties such as temperature and pressure.
For example, broadened can be used to describe the spectral lines of a XRPD spectrum of ground or pulverized material comprising a crystalline compound relative to the material prior to grinding. In materials where the constituent molecules, ions or atoms, as solvated or hydrated, are not tumbling rapidly, line broadening is indicative of increased randomness in the orientation of the chemical moieties of the compound, thus indicative of an increased amorphous content. When comparisons are made between crystalline materials obtained via different crystallization conditions, broader spectral lines indicate that the material producing the relatively broader spectral lines has a higher level of amorphous material.
“About” as the term is used herein, refers to an estimate that the actual value falls within ±5% of the value cited. “Forked” as the term is used herein to describe DSC endotherms and exotherms, refers to overlapping endotherms or exotherms having distinguishable peak positions
. 
Classes of multicomponent pharmaceutical materials. (a) Schematic of crystalline materials showing neutral and charged species. The red box indicates polymorphs are possible for all the multicomponent crystals contained within the box (adapted from Reference 7). (b) Schematic of amorphous solid dispersions showing binary, ternary, and quaternary possibilities for polymers and surfactants. Other solubilization techniques using cyclodextrins and phospholipids are included for completeness but have a different mechanism for solubilization when compared to polymer and surfactant systems.
The red box indicates that properties can change with water or solvent content. General methods for precipitating and crystallizing a compound may be applied to prepare the various polymorphs described herein. These general methods are known to those skilled in the art of synthetic organic chemistry and pharmaceutical formulation, and are described, for example, by J. March, “Advanced Organic Chemistry: Reactions, Mechanisms and Structure ” 4th Ed. (New York: Wiley-Interscience, 1992).
In general, a given polymorph of a compound may be obtained by direct crystallization of the compound or by crystallization of the compound followed by inter-conversion from another polymorphic form or from an amorphous form. Depending on the method by which a compound is crystallized, the resulting composition may contain different amounts of the compound in crystalline form as opposed to as an amorphous material.
Also, the resulting composition may contain differing mixtures of different polymorphic forms of the compound. Compositions comprising a higher percentage of crystalline content {e.g., forming crystals having fewer lattice defects and proportionately less glassy material) are generally prepared when using conditions that favor slower crystal formation, including slow solvent evaporation and those affecting kinetics.
Crystallization conditions may be appropriately adjusted to obtain higher quality crystalline material as necessary. Thus, for example, if poor crystals are formed under an initial set of crystallization conditions, the solvent temperature may be reduced and ambient pressure above the solution may be increased relative to the initial set of crystallization conditions in order to slow down crystallization.  Precipitation of a compound from solution, often affected by rapid evaporation of solvent, is known to favor the compound forming an amorphous solid as opposed to crystals. A compound in an amorphous state may be produced by rapidly evaporating solvent from a solvated compound, or by grinding, pulverizing or otherwise physically pressurizing or abrading the compound while in a crystalline state.
Seven crystalline forms and one amorphous solid were identified by conducting a polymorph screen (Example 3). Described herein are Form A, Form B, Form C, Form D, Form E, Form F, Form G, and Amorphous Form of Compound I. Where possible, the results of each test for each different polymorph are provided. Forms A, C, D and E were prepared as pure forms. Forms B, F, and G were prepared as mixtures with Form A.
Various tests were performed in order to physically characterize the polymorphs of Compound I including X-ray powder diffraction (XRPD), differential scanning calorimetry (DSC), thermogravimetric analysis (TGA), hot stage microscopy, Fourier transform infrared spectroscopy (FT-IR), Fourier transform Raman spectrometry, linked thermogravimetric-infrared spectroscopy (TG-IR), solution proton nuclear magnetic resonance (1H-NMR), solid state 13carbon nuclear magnetic resonance (13C-NMR), and moisture sorption and desorption analysis (M S/Des).

Salt screening
Physicochemical properties of drug substances, such as solubility, dissolution rate, and physicochemical stability can be altered significantly by salt formation. Consequently, important properties of the drug product such as bioavailability or shelve life can be radically influenced. Crystallics’ technology platform for crystallization screening accommodates salt screening studies using only minimal amounts of drug substance while still performing a large number of experiments. High-throughput salt screening is used for both early phase salt selection studies and broad patent protection.
Salt selection – A powerful strategy for crystal form optimization
Pharmaceutical developers have focused efforts on finding and formulating a thermodynamically stable crystalline form with acceptable physical properties for a given compound. This is reasonable, given the need to avoid cascading from a meta-stable form to a more stable one in unpredictable fashion.
Occasionally certain physical properties, such as low aqueous solubility, are limiting to performance of the compound, leading to poor oral bioavailability or insufficient solubility for an injection formulation. One of the main strategies used to affect physical performance of a compound and one that is often employed by pharmaceutical scientists is the practice of salt selection (23). At least half of compounds in marketed products are in the form of a salt for one reason or another.
This fact alone speaks to the versatility of the salt selection approach. Salt forms of a pharmaceutical can have many benefits, such as improved stability characteristics, optimal bioavailability and aqueous solubility for an injectable formulation. Salts, like all other crystalline forms, are subject to polymorphism and solvate formation, thus requiring the same form identification studies as are needed for a neutral compound.
A remarkable example of co-optimization of properties is indinavir (HIV protease inhibitor), which is marketed as the sulfate salt ethanol solvate (24,25) The crystalline free base has variable oral bioavailability in dogs (26,27) and humans (28). While acidic solutions of the base compound showed good oral pharmacokinetics, the stability of the drug in acidic solution is not consistent with a product (26). Therefore, the discovery of the salt form ensured both shelf stability and robust bioavailability performance. The salt selection strategy is limited in two ways.
First, salt formation relies on the presence of one or more ionizable functional groups in the molecule; many drugs and development compounds lack this feature.
Second, our ability to predict a priori whether a given compound will form a crystalline salt (or salts) is non-existent. The ability to actively identify crystalline salt forms has been confined to manual empirical evaluation using multiple salt formers for a given acid or base. Recently advances have been made in the area of high-throughput salt selection and crystal engineering strategies associated with salt formation (14,29-32).
In one case, we have advocated the simultaneous assessment of polymorphism as a way to help rank the developability of different crystalline salts (14). While salt forms will continue to have a prominent place in pharmaceutical science, the need for enhanced productivity dictates that every advantage must be sought to aid the design of an appropriate crystalline form of an active molecule.
Specifically, the ability to design scaffolds into crystalline forms will enhance our capacity to convert interesting molecules into effective drugs. Crystal engineering offers some additional tools in this regard. 
CASE STUDY FORM A ONLY US8084605
TRELAGLIPTIN SUCCINATE
Form A may be prepared by crystallization from the various solvents and under the various crystallization conditions used during the polymorph screen (e.g., fast and slow evaporation, cooling of saturated solutions, slurries, and solvent/antisolvent additions). Tables B and C of Example 3 summarize the procedures by which Form A was prepared.
For example, Form A was obtained by room temperature slurry of an excess amount of Compound I in acetone, acetonitrile, dichloromethane, 1,4-dioxane, diethyl ether, hexane, methanol, isopropanol, water, ethylacetate, tetrahydrofuran, toluene, or other like solvents on a rotating wheel for approximately 5 or 7 days.
The solids were collected by vacuum filtration, and air dried in the hood. Also, Form A was precipitated from a methanol solution of Compound I by slow evaporation (SE). Form A was characterized by XRPD, TGA, hot stage microscopy, IR, Raman spectroscopy, solution 1H-NMR, and solid state 13C-NMR. Figure 1 shows a characteristic XRPD spectrum (CuKa, λ=1.5418A) of Form A. The XRPD pattern confirmed that Form A was crystalline. Major X-Ray diffraction lines expressed in °2Θ and their relative intensities are summarized in Table 1. Table 1. Characteristic XRPD Peaks (CuKa) of Form A


The above set of XRPD peak positions or a subset thereof can be used to identify Form A. One subset comprises peaks at about 11.31, 11.91, 12.86, 14.54, 15.81, 16.83, 17.59, 19.26, 19.52, 21.04, 22.32, 26.63, and 29.87 °2Θ. Another subset comprises peaks at about 11.31, 11.91, 19.26, 21.04, and 22.32 °2Θ; the peaks of this subset show no shoulder peaks or peak split greater than 0.2 °2Θ. Another subset comprises peaks at about 11.31, 11.91 and 22.32 °2Θ.  Figure 2 is a TGA thermogram of Form A. TGA analysis showed that Form A exhibited insignificant weight loss when heated from 25 0C to 165 0C; this result is indicative that Form A was an anhydrous solid.
  Figure 3 shows a characteristic DSC thermogram of Form A. DSC analysis showed a single endothermic event occurred at approximately 195 0C (peak maximum). This endothermic event was confirmed by hot stage microscopy which showed the melting of Form A, which onset around 177 0C and the melting point estimated to be at approximately 184 0C.
Figure 4 (A-D) shows a characteristic FT-IR spectrum of Form A. The major bands expressed in reciprocal wavelengths (wavenumber in cm”1) are positioned at about 3815, 3736, 3675, 3460, 3402, 3141, 3098, 3068, 3049, 2953, 2934, 2854, 2760, 2625, 2536, 2481, 2266, 2225, 2176, 1990, 1890, 1699, 1657, 1638, 1626, 1609, 1586, 1553, 1517, 1492, 1478, 1450, 1419, 1409, 1380, 1351, 1327, 1289, 1271, 1236, 1206, 1180, 1158, 1115, 1087, 1085, 1064, 1037, 1027, 971, 960, 951, 926, 902, 886, 870, 831, 820, 806, 780, 760, 740, 728, 701, 685, 668, 637, 608, 594, 567, 558, and 516 cm”1 (values rounded to the nearest whole number). This unique set of IR absorption bands or a subset thereof can be used to identify Form A.
One such subset comprises absorption bands at about 3141, 3098, 3068, 3049, 2953, 2934, 2854, 2266, 2225, 1699, 1657, 1609, 1586, 1553, 1517, 1492, 1478, 1450, 1380, 1351, 1327, 1236, 1206, 1115, 1063, 902, 886, 870, 820, 780, 760, 685, 608, 594, and 516 cm 1. Another subset comprises absorption bands at about 3141, 2953, 2934, 2854, 2266, 2225, 1699, 1657, 1450, 1206, 886, 760, 685, 594, and 516 cm 1. Yet another subset comprises absorption bands at about 3141, 2953, 2934, 2266, 1699, 1657, 1450, and 1206 cm 1.
Aprepitant case study FTIR.. READING MATERIAL http://alpha.chem.umb.edu/chemistry/ch361/spring%2005/ftir%20polymorph.pdf
Figure 5 (A-D) shows a characteristic Raman spectrum of Form A. The major Raman bands expressed in reciprocal wavelengths (wavenumber in cm”1) are positioned at about 3100, 3068, 3049, 2977, 2954, 2935, 2875, 2855, 2787, 2263, 2225, 2174, 1698, 1659, 1626, 1607, 1586, 1492, 1478, 1451, 1439, 1409, 1400, 1382, 1351, 1328, 1290, 1281, 1271, 1237, 1223, 1213, 1180, 1155, 1134, 1115, 1084, 1063, 1035, 971, 952, 926901, 868, 805, 780, 759, 740, 727, 701, 686, 669, 609, 594, 566, 558, 516, 487, 479, 433, 418, 409, 294, 274, 241, 218, 191 and 138 cm”1 (values rounded to the nearest whole number). This unique set of Raman bands or a subset thereof may be used to identify Form A.
One such subset comprises Raman bands at about 2954, 2935, 2225, 1698, 1659, and 1607 cm”1. Another subset comprises Raman bands at about 3068, 2954, 2935, 2225, 1698, 1659, 1607, 1586, 1223, 1180, 901, 780, 759, 669, and 516 cm”1. Yet another subset comprises Raman bands at about 3100, 3068, 2225, 1698, 1659, 1607, 1586, 1351, 1237, 1223, 1180, 1155, 1134, 1115, 1063, 952, 926, 901, 868, 805, 780, 759, 740, 669, 609, and 516 cm”1.
Form A was further characterized by solution 1H NMR and solid-state 13carbon NMR. The spectra are reported in Figures 6 and 7, respectively. Chemical assignments were not performed; however, the spectra are consistent with the known chemical structure of Compound I. US8084605

 Example 11. Characterization of Form A Material prepared by the procedure of Example 1 was designated as Form A. The material was characterized by XRPD, TGA, DSC, hot stage microscopy, FT-IR, FT- Raman, 1H NMR, and 13C NMR. The analyses were conducted according to the procedures outlined in Section B of Example 3.
The characteristic spectra and thermograms for Form A are reported in Figures 1-7. The characterization data are summarized in Table D. Table D. Characterization Data of Form A of Compound I US8084605

Amorphous solid dispersion screening
Using the amorphous form of a drug substance offers several advantages with respect to dissolution rate and solubility of the substance. However, reduced chemical stability, increased hygroscopicity and, most important, physical instability are the major drawbacks of using the amorphous phase in the final drug product. These drawbacks can be overcome by stabilizing the amorphous phase of the API in a polymer matrix, e.q. an amorphous solid dispersion. Amorphous phases dissolve more rapidly than crystalline forms, and can significantly increase bioavailability of poorly water soluble drugs substances. However, the use of amorphous materials requires confidence that crystallization will not occur during the product lifespan. For a material that has never been obtained in a crystalline form, focus should be put on attempting to crystallize it. Crystallics has extensive experience of obtaining crystalline phases from amorphous materials.
Dispersions of a drug substance onto a polymeric matrix has received increased attention in recent years. A successful dispersion results in an amorphous solid material and will show improved dissolution rates and higher apparent solubility characteristics, as well as, sufficient resistance to chemical degradation and should be physically stable e.q. sufficient high glass transition temperature avoiding crystallization of the API.
A variety of factors contribute to the formation of a suitable Amorphous Solid Dispersion (ASD), including the nature of the polymer, the drug polymer ratio, the impact of surfactants and the solvent used in the process. Crystallics has developed high-throughput solid dispersion screening technology in order to find the optimal combination of these factors.
Example 10. Preparation of Amorphous Form US8084605
A sample of Compound I (40 mg) was dissolved in 1000 μl of water. The solution was filtered through a 0.2 μm nylon filter into a clean vial then frozen in a dry ice/acetone bath. The vials were covered with a Kimwipe then placed on a lyophilizer overnight. The resulting solids yielded Amorphous Form. 8. Amorphous Form The Amorphous Form of Compound I was prepared by lyophilization of an aqueous solution of Compound I (Example 10). The residue material was characterized by XRPD and the resulting XRPD spectrum displayed in Figure 26. The XRPD spectrum shows a broad halo with no specific peaks present, which confirms that the material is amorphous. The material was further characterized by TGA, DSC, hot stage microscopy, and moisture sorption analysis. 
TGA analysis (Figure 27) showed a 1.8% weight loss from 25 0C to 95 0C, which was likely due to loss of residual solvent. 
DSC analysis (Figure 28) showed a slightly concave baseline up to an exotherm at 130 0C (recrystallization), followed by an endotherm at 194 0C, which results from the melting of Form A. Hot stage microscopy confirmed these recrystallization and melting events (micrographs not included). An approximate glass transition was observed (Figure29) at an onset temperature of 82 0
C. 
Moisture sorption/desorption data (Figure 30 and Example 25) showed a 1.0% weight loss on equilibration at 5% relative humidity. Approximately 8% of weight was gained up to 65% relative humidity. Approximately 7% of weight was lost at 75% relative humidity. This is likely due to the recrystallization of the amorphous material to a crystalline solid. A 4.4% weight gain was observed on sorption from 75% to 95% relative humidity. Approximately 4.7% weight was lost on desorption from 95% to 5% relative humidity. 
The solid material remaining after the moisture sorption analysis was determined to be Form A by XRPD (Figure 31). Table H. Characterization Data of Amorphous Form US8084605

T=temperature, RH=relative humidity, MB = moisture sorption/desorption analysis Example 19: Relative Humidity Stressing Experiments

Table B. Crystallization Experiments of Compound I from Solvents


a) FE = fast evaporation; SE = slow evaporation; RT = room temperature; SC = slow cool; CC = crash cool, MB = moisture sorption/desorption analysis b) qty = quantity; PO = preferred orientation Table C. Crystallization Experiments of Compound I in Various Solvent/Antisolvent

a precipitated by evaporation of solvent Table A. Approximate Solubilities of Compound I US8084605


a) Approximate solubilities are calculated based on the total solvent used to give a solution; actual solubilities may be greater because of the volume of the solvent portions utilized or a slow rate of dissolution. Solubilities are reported to the nearest mg/mL.
Example 3.
Polymorph Screen Compound I as prepared by the method described in Example 1 was used as the starting material for the polymorph screen. Solvents and other reagents were of ACS or HPLC grade and were used as received. A. Sample Generation. Solids for form identification were prepared via the following methods from Compound I.
1. Fast Evaporation (FE) A solution of Compound I was prepared in test solvents. The sample was placed in the hood, uncovered, to evaporate under ambient conditions. The solids were analyzed by XRPD for form identification.
2. Slow Evaporation (SE) A solution of Compound I was prepared in test solvents. The sample was placed in the hood, covered with foil rendered with pinholes, to evaporate under ambient conditions. The solids were analyzed by XRPD for form identification.
3. Room Temperature (RT) Slurries An excess amount of Compound I was slurried in test solvent on a rotating wheel for approximately 5 or 7 days. The solids were typically collected by vacuum filtration, air dried in the hood, and analyzed by XRPD for form identification.
4. Elevated Temperature Slurries Excess Compound I was slurried in test solvents at 47 0C on a shaker block for approximately 5 days. The solids were collected by vacuum filtering, dried in the hood, and then analyzed by XRPD for form identification.
5. Slow Cooling Crystallization (SC)
A saturated or near saturated solution of Compound I was prepared at elevated temperature. The samples were filtered through warmed 0.2 μm filters into warmed vials. The heat source was turned off and the samples slowly cooled to ambient temperature. If precipitation did not occur within a day the samples were placed in the refrigerator. The samples were transferred to a freezer if precipitation did not occur within several days. The solids were collected by decanting the solvent or vacuum filtration, dried in the hood and analyzed by XRPD for form identification.
6. Crash Cooling Crystallization (CC) A saturated or near saturated solution of Compound I was prepared at elevated temperature. The samples were filtered through warmed 0.2 μm filters into warmed vials then rapidly cooled in an acetone/dry ice or ice bath. If precipitation did not occur after several minutes the samples were placed in the refrigerator or freezer. Solids were collected by decanting solvent or vacuum filtration, dried in the hood, and then analyzed by XRPD. Samples that did not precipitate under subambient conditions after several days were evaporated in the hood and analyzed by XRPD for form identification.
7. Solvent/Antisolvent Crystallization (S/AS) A solution of Compound I was prepared in test solvent. A miscible antisolvent was added with a disposable pipette. Precipitate was collected by vacuum filtration or decanting solvent. The samples were stored under subambient conditions if precipitation did not occur. If solids were not observed after several days the samples were evaporated in the hood. Collected solids were analyzed by XRPD for form identification.
8. Relative Humidity (RH) Stressing Experiments Samples of Compound I were placed uncovered in approximately 58%, 88%, and 97% relative humidity jars. The samples were stored in the jars for approximately 8 days. The solids were collected and analyzed by XRPD for form identification.
9. Lyophilization Compound I was dissolved in water in a glass vial. The solution was frozen by swirling the vial in an acetone/dry ice bath. The frozen sample was placed on the lyophilizer until all of the frozen solvent was removed. The solids were collected and analyzed by XRPD for form identification.
10. Grinding Experiments Aliquots of Compound I were ground manually with a mortar and pestle as a dry solid and a wet paste in water. The samples were ground for approximately three minutes. The solids were collected and analyzed by XRPD for form identification.
11. Dehydration Experiments Hydrated samples of Compound I were dehydrated at ambient conditions (2 days) and in an ambient temperature vacuum oven (1 day). The solids were collected and analyzed by XRPD for form identification.
12. Vapor Stress Experiments Amorphous Compound I was placed in acetone, ethanol, and water vapor chambers for up to eight days. The solids were collected and analyzed by XRPD for form identification.
STABILITY STUDY Stability studies are commonly performed for new drug entities with chemical stability and impurity formation being investigated. It is also important to monitor the physical stability under these same conditions to anticipate any form changes that may occur. As an example, many hydrates will dehydrate to a lower hydrate or anhydrous form at elevated temperatures. Anhydrous materials can also undergo form transformations to other anhydrous forms upon heating.
These types of changes can be monitored using heating studies in an oven with subsequent XRPD analysis or in-situ variable temperature XRPD can be used to look for changes. In other cases, anhydrates will convert to hydrates or the API in an amorphous solid dispersion may crystallize under elevated relative humidity (RH) conditions.
Equilibration in RH chambers with subsequent analysis by XRPD or in-situ variable RH XRPD experiments can be used to readily identify these form changes. Once the effect of temperature and RH on form changes is understood, this can be factored into other processes such as drying, formulation, storage, and packaging B. Sample Characterization. The following analytical techniques and combination thereof were used determine the physical properties of the solid phases prepared.
1. X-Ray Powder Diffraction (XRPD)
XRPD is commonly used as the initial method of analysis for form screens. For polymorph, salt, and co-crystal screens XRPD is used to determine if a new form has been produced by comparing the powder pattern to all known forms of the API and the counterion/guest. If a new form is found by XRPD, additional characterization by other methods is in order. For amorphous solid dispersion screens, XRPD is used to confirm a lack of crystallinity indicated by an amorphous halo in the powder pattern.
The halos will move depending on the concentration and interactions of the API and polymer. Computational methods have also been used with XRPD data to establish miscibility of amorphous solid dispersions X-ray powder diffraction is a front line technique in solid form screening and selection based on its ability to give a fingerprint of the solid-state structure of a pharmaceutical material. Understanding the solid forms of a pharmaceutical compound provides a road map to help direct a variety of development activities ranging from crystallization, formulation, packaging, storage, and performance.
Different screening and selection strategies are warranted in early and late development because different information is needed at the various stages. Solid form selection and formulation approaches need to be investigated together and tailored to the situation. It is important to include solid form selection and possible changes in form as part of the risk management strategy throughout the drug development process.
X-ray powder diffraction (XRPD) analyses were performed using an Inel XRG- 3000 diffractometer equipped with a CPS (Curved Position Sensitive) detector with a 2Θ (2Θ) range of 120°. Real time data were collected using Cu-Ka radiation starting at approximately 4 °2Θ at a resolution of 0.03 °2Θ. The tube voltage and amperage were set to 40 kV and 30 mA, respectively. The pattern is displayed from 2.5 to 40 °2Θ. Samples were prepared for analysis by packing them into thin- walled glass capillaries. Each capillary was mounted onto a goniometer head that is motorized to permit spinning of the capillary during data acquisition. The samples were analyzed for approximately 5 minutes.
Instrument calibration was performed using a silicon reference standard. Peak picking was performed using the automatic peak picking in the Shimadzu XRD-6000 Basic Process version 2.6. The files were converted to Shimadzu format before performing the peak picking analysis. Default parameters were used to select the peaks.
2. Thermogravimetric Analysis (TGA)
Thermogravimetric (TG) analyses were performed using a TA Instruments 2950 thermogravimetric analyzer. Each sample was placed in an aluminum sample pan and inserted into the TG furnace. The furnace was first equilibrated at 25 0C, then heated under nitrogen at a rate of 10 °C/min, up to a final temperature of 350 0C. Nickel and Alumel™ were used as the calibration standards.
3. Differential Scanning Calorimetry (DSC)
Differential scanning calorimetry (DSC) was performed using a TA Instruments differential scanning calorimeter 2920. The sample was placed into an aluminum DSC pan, and the weight accurately recorded. The pan was covered with a lid and then crimped. The sample cell was equilibrated at 25 0C and heated under a nitrogen purge at a rate of 10 °C/min, up to a final temperature of 350 0C. Indium metal was used as the calibration standard. Reported temperatures are at the transition maxima. For studies of the glass transition temperature (Tg) of the amorphous material, the sample cell was equilibrated at ambient temperature, then heated under nitrogen at a rate of 20 °C/min, up to 100 0C. The sample cell was then allowed to cool and equilibrate at -20 0C. It was again heated at a rate of 20 °C/min up to 100 0C and then cooled and equilibrated at -20 0C. The sample cell was then heated at 20 °C/min up to a final temperature of 350 0C. The Tg is reported from the onset point of the transition.
4. Hot Stage Microscopy.
Hot stage microscopy was performed using a Linkam hot stage (model FTIR 600) mounted on a Leica DM LP microscope. The samples were prepared between two cover glasses and observed using a 20χ objective with crossed polarizers and first order compensator. Each sample was visually observed as the stage was heated. Images were captured using a SPOT Insight™ color digital camera with SPOT Software v. 3.5.8. The hot stage was calibrated using USP melting point standards.
5. Thermogravimetric-Infrared (TG-IR)
Thermogravimetric infrared (TG-IR) analyses were acquired on a TA Instruments thermogravimetric (TG) analyzer model 2050 interfaced to a Magna 560® Fourier transform infrared (FT-IR) spectrophotometer (Thermo Nicolet) equipped with an Ever-Glo mid/far IR source, a potassium bromide (KBr) beamsplitter, and a deuterated triglycine sulfate (DTGS) detector. The TG instrument was operated under a flow of helium at 90 and 10 cc/min for the purge and balance, respectively. Each sample was placed in a platinum sample pan, inserted into the TG furnace, accurately weighed by the instrument, and the furnace was heated from ambient temperature to 250 0C at a rate of 20 °C/min.
The TG instrument was started first, immediately followed by the FT-IR instrument. Each IR spectrum represents 32 co-added scans collected at a spectral resolution of 4 cm“1. A background scan was collected before the beginning of the experiment. Wavelength calibration was performed using polystyrene. The TG calibration standards were nickel and Alumel™. Volatiles were identified from a search of the High Resolution Nicolet TGA Vapor Phase spectral library.
6. Fourier Transform Infrared Spectroscopy (FT-IR)
Infrared spectra were acquired on a Magna-IR 560® or 860® Fourier transform infrared (FT-IR) spectrophotometer (Thermo Nicolet) equipped with an Ever-Glo mid/far IR source, an extended range potassium bromide (KBr) beamsplitter, and a deuterated triglycine sulfate (DTGS) detector. A diffuse reflectance accessory (the Collector™, Thermo Spectra-Tech) was used for sampling. Each spectrum represents 256 co-added scans collected at a spectral resolution of 4 cm“1. Sample preparation consisted of physically mixing the sample with KBr and placing the sample into a 13 -mm diameter cup. A background data set was acquired on a sample of KBr. A Log 1/R (R = reflectance) spectrum was acquired by taking a ratio of these two data sets against each other. Wavelength calibration was performed using polystyrene. Automatic peak picking was performed using Omnic version 7.2.
7. Fourier Transform Raman Spectroscopy (FT-Raman)
FT-Raman spectra were acquired on a Raman accessory module interfaced to a Magna 860® Fourier transform infrared (FT-IR) spectrophotometer (Thermo Nicolet). This module uses an excitation wavelength of 1064 nm and an indium gallium arsenide (InGaAs) detector. Approximately 0.5 W of Nd)YVO4 laser power was used to irradiate the sample. The samples were prepared for analysis by placing the material in a glass tube and positioning the tube in a gold-coated tube holder in the accessory. A total of 256 sample scans were collected from at a spectral resolution of 4 cm“1, using Happ-Genzel apodization. Wavelength calibration was performed using sulfur and cyclohexane. Automatic peak picking was performed using Omnic version 7.2.
8. Solid State Nuclear Magnetic Resonance Spectroscopy (13C-NMR)
The solid-state 13C cross polarization magic angle spinning (CP/MAS) NMR spectrum was acquired at ambient temperature on a Varian UN1TYINOVA-400 spectrometer (Larmor frequencies: 13C = 100.542 MHz, 1H = 399.799 MHz). The sample was packed into a 4 mm PENCIL type zirconia rotor and rotated at 12 kHz at the magic angle. The spectrum was acquired with phase modulated (SPINAL-64) high power 1H decoupling during the acquisition time using a 1H pulse width of 2.2 μs (90°), a ramped amplitude cross polarization contact time of 5 ms, a 30 ms acquisition time, a 10 second delay between scans, a spectral width of 45 kHz with 2700 data points, and 100 co-added scans. The free induction decay (FID) was processed using Varian VNMR 6.1C software with 32768 points and an exponential line broadening factor of 10 Hz to improve the signal-to- noise ratio. The first three data points of the FID were back predicted using the VNMR linear prediction algorithm to produce a flat baseline. The chemical shifts of the spectral peaks were externally referenced to the carbonyl carbon resonance of glycine at 176.5 ppm. 9. Solution Nuclear Magnetic Resonance Spectroscopy (1H-NMR) The solution 1H NMR spectrum was acquired at ambient temperature with a
spectrometer at a 1H Larmor frequency of 399.803 MHz. The sample was dissolved in methanol. The spectrum was acquired with a 1H pulse width of 8.4 μs, a 2.50 second acquisition time, a 5 second delay between scans, a spectral width of 6400 Hz with 32000 data points, and 40 co-added scans. The free induction decay (FID) was processed using Varian VNMR 6.1C software with 65536 points and an exponential line broadening factor of 0.2 Hz to improve the signal-to-noise ratio. The spectrum was referenced to internal tetramethylsilane (TMS) at 0.0 ppm. 10.
Moisture Sorption/Desorption Analysis Moisture sorption/desorption data were collected on a VTI SGA-100 Vapor Sorption Analyzer. Sorption and desorption data were collected over a range of 5% to 95% relative humidity (RH) at 10% RH intervals under a nitrogen purge. Samples were not dried prior to analysis. Equilibrium criteria used for analysis were less than 0.0100% weight change in 5 minutes, with a maximum equilibration time of 3 hours if the weight criterion was not met. Data were not corrected for the initial moisture content of the samples. NaCl and PVP were used as calibration standards
Does solid form matter?
Sometimes the properties of two solid forms of a drug are quite similar. In other cases, the physical and chemical properties can vary dramatically and have great impact on pharmacokinetics, ease of manufacturing, and dosage form stability. Properties that can differ among solid forms of a substance include color, solubility, crystal shape, water sorption and desorption properties, particle size, hardness, drying characteristics, flow and filterability, compressibility, and density.
Different solid forms can have different melting points, spectral properties, and thermodynamic stability. In a drug substance, these variations in properties can lead to differences in dissolution rate, oral absorption, bioavailability, levels of gastric irritation, toxicology results, and clinical trial results. Ultimately both safety and efficacy are impacted by properties that vary among different solid forms. Stability presents a special concern, since it’s easy to inadvertently generate the wrong form at any point in the development process.
Because energy differences between forms are usually relatively small, form interconversion is common and can occur during routine API manufacturing operations and during drug product formulation, storage, and use. The stakes are high. Encountering a new solid form during late stages of development can delay filing. A new form appearing in drug product can cause product withdrawal.
When should a search for solid forms begin?
The key to speed in the drug development process is to do it right the first time. For solid pharmaceuticals, that means:
- identify the optimum solid form early in drug development
- make the same form for clinical material and commercial API
- develop a crystallization process that assures control of solid form
- produce a drug product with solid form stability through expiration
scientists strongly recommend that investigation of possible solid forms of a new chemical entity be carried out as early in the development process as drug supply will allow. The best approach has three stages. The first stage, more relevant to some development processes than to others, is a milligram-scale abbreviated screen on efficacious compounds prior to final IND candidate selection. This early information can be used to guide selection of salts and solid forms for scale-up and toxicology studies. The second stage is full polymorph screening and selection of optimum solid form. This stage is important to all development processes and should certainly occur before the first GMP material is produced. In the case of ionic drugs, various salts should be prepared and screened for polymorphs and hydrates. The third stage, an exhaustive screen carried out before drug launch, is an effort to find and patent all of the forms of a high-potential drug. Staging the screening in this way optimizes the balance among the factors of early knowledge of options, probability of commercial success, and judicious investment of R&D money.
 Delay in understanding solid form issues results in problems like different batches of clinical material having different solid forms. Another common and preventable dilemma arises when clinical trials are carried out with one form while commercial production generates another. In this case, bridging studies are required to demonstrate to regulatory agencies that the clinicals are relevant. ICH guidelines require a search for solid forms, comparison of properties that might affect product efficacy, and, if appropriate, setting of solid form specifications.
How is solid form controlled in API manufacture?
It is important to control solid form during API synthesis in order to demonstrate complete process control to regulatory agencies. Different solid forms can have different solubilities and can affect recovery of API. Purification efficiencies can vary due to differential exclusion of impurities. Filtration and transfer characteristics often differ between forms. Ease of drying can vary due to different abilities to bind solvent and water in the crystal lattice. A prevalent but incorrect belief is that solid form is determined primarily by choice of crystallization solvent. In fact, it is well established that parameters like temperature, supersaturation level, rate of concentration or cooling, seeding, and ripening can have an overriding effect. These variables must be controlled to ensure consistency of solid form in API.
Can solid form problems arise in drug products, too?
The potential for solid form variation does not end at API production. Solid form issues remain through formulation, manufacture, storage, and use of drug product. It is common to observe form transformation during standard manufacturing operations like wet granulation and milling. Excipient interactions and compaction can induce form changes. Changes can occur in the final dosage form over time. Suspensions, including those in transdermal patches, are particularly vulnerable because they provide a low-energy pathway (dissolution/recrystallization) for form interconversion. Lyophile cakes are normally amorphous, but can crystallize on storage leading to difficulty in reconstitution. Even products containing drug in solution, such as filled gel caps, can be affected if the solution is or becomes supersaturated with respect to one of the possible solid forms of the drug.
How can you tell when you have a solid form problem?
Whenever there is a specification failure in drug product or drug substance, solid form changes should be considered in the search for causes. Particularly symptomatic is failure to meet melting point or dissolution specifications. Changes in humidity, crystallization conditions, or crystallization solvent can produce unwanted forms. Solvents known to readily produce solvates include water, alcohols, chlorinated hydrocarbons, cyclic ethers, ketones, nitriles, and amides. Changes in the appearance of gel caps or cracking of tablet coatings can indicate solid form problems. Various solid-state analytical techniques can be used to identify solid form in API. Some techniques can even determine solid form of API in intact final dosage form. Among the most useful techniques for solid-state characterization are melting point, DSC, TGA, hot stage and optical microscopy, solid-state NMR, IR and Raman spectroscopy, and X-ray powder diffraction.
Is there any good news about polymorphism?
Polymorphism presents opportunities as well as challenges. Investigation of the properties of different forms of a commercial drug can lead to new products with improved onset time, greater bioavailability, sustained release properties, or other therapeutic enhancements. New forms can bring improvements in manufacturing costs or API purity. These improvements are patentable and can provide a competitive advantage. An underutilized potential of polymorphism is to solve formulation problems that cause the abandonment of potentially useful drugs in which much investment has already been made. 
SOLUBILITY
Solubility is an important parameter for new molecules especially with the emergence of many poorly soluble compounds in the drug discovery and development pipeline. Polymorphic forms can exhibit solubility differences that vary within a factor of 1-5, amorphous solid dispersions show an improvement one or two orders of magnitude higher, and salts and co-crystals fall between these extremes . A comparison of solubility values of pure forms will provide important information when deciding on a solid form or dosage form. X-ray powder diffraction will allow identification of pure forms for these types of measurements.
However, form changes during solubility and dissolution experiments are also possible and need to be investigated. Solids remaining at the end of solubility and dissolution experiments should always be analyzed initially by XRPD to determine if a form transformation has occurred under these conditions. If a form change has occurred, XRPD patterns can be compared to known forms (polymorphs, hydrates, salts, free acid/base) in order to identify the solids remaining. If a pattern is obtained that does not correspond to known forms, complementary methods will be needed to determine properties such as hydration state or a change in stoichiometry as would be observed from breaking a salt and forming the free acid/base or the formation of salts in buffered solutions.
FORMULATION
Formulators are charged with the responsibility to formulate a product which is physically and chemically stable, manufacturable, and bioavailable. Most drugs exhibit structural polymorphism, and it is preferable to develop the most thermodynamically stable polymorph of the drug to assure reproducible bioavailability of the product over its shelf life under a variety of real-world storage conditions. There are occasional situations in which the development of a metastable crystalline or amorphous form is justified because a medical benefit is achieved. Such situations include those in which a faster dissolution rate or higher concentration are desired, in order to achieve rapid absorption and efficacy, or to achieve acceptable systemic exposure for a low-solubility drug.
Another such situation is one in which the drug remains amorphous despite extensive efforts to crystallize it. If there is no particular medical benefit, there is less justification for accepting the risks of intentional development of a metastable crystalline or amorphous form. Whether or not there is medical benefit, the risks associated with development of a metastable form must be mitigated by laboratory work which provides assurance that (a) the largest possible form change will have no substantive effect on product quality or bioavailability, and/or (b) a change will not occur under all reasonable real-world storage conditions, and/or (c) analytical methodology and sampling procedures are in place which assure that a problem will be detected before dosage forms which have compromised quality or bioavailability can reach patients.
Crystal engineering and co-crystals
Crystal engineering is generally considered to be the design and growth of crystalline molecular solids with the aim of impacting material properties. A principal tool is the hydrogen bond, which is responsible for the majority of directed intermolecular interactions in molecular solids. Co-crystals are multi-component crystals based on hydrogen bonding interactions without the transfer of hydrogen ions to form salts – this is an important feature, since Brønsted acid-base chemistry is not a requirement for the formation of a co-crystal.
Co-crystallization is a manifestation of directed self-assembly of different components. Co-crystals have been described of various organic substances over the years (33,34) and given various names, such as addition compounds (35,36) molecular complexes (37,38) and heteromolecular co-crystals (39). Regardless of naming convention, the essential meaning is that of a multi-component crystal where no covalent chemical modification of the constituents occurs as a result of the crystal formation. Pharmaceuticals co-crystals have only recently been discussed as useful materials for drug products.
Pharmaceutical co-crystals
Pharmaceutical co-crystals can be defined as crystalline materials comprised of an active pharmaceutical ingredient (API) and one or more unique co-crystal formers, which are solids at room temperature. Co-crystals can be constructed through several types of interaction, including hydrogen bonding, p-stacking, and van der Waals forces. Solvates and hydrates of the API are not considered to be co-crystals by this definition. However, co-crystals may include one or more solvent/water molecules in the crystal lattice. An example of putative design, a construction and preparation process is shown in Figure 2 for the 5-fluororuracil:urea 1:1 co-crystal(40).
This real example neatly illustrates the opportunity and challenge that exists currently with designing pharmaceutical co-crystals. Firstly, the ‘design’ is challenging because we have no ability to predict the exact crystal structure that may result from a crystallization attempt. By analogy to the challenge of deriving protein structure from first principles, the primary sequence (chemical structure in our case) is known and elements of secondary structure (the 2-D tape construction in Figure 2) are somewhat discernible from primary information. Prediction of the actual 3-D folded conformation (tertiary structure or obtained by self-assembly) is not possible. In other words, while we currently have the ability to project which things associate in what approximate manner on the secondary level, crystal structure prediction is essentially an intractable proposition.
By extension, and just as the exact function of a protein and quantitative parameters of activity are not predictable from primary and secondary structure, the prediction of crystal properties is not possible in the absence of structural information and measurements. There is early evidence that practitioners were aware that apparent co-crystallization of drugs could lead to useful preparations (41). In fact, a ‘chemical compound’ composed of sulfathiazole and proflavin dubbed flavazole was used to treat bacterial infection during the Second World War (42).
The case of flavazole reveals insight into how two different molecules might interact in a putative co-crystal:“… flavazole is definitely a chemical compound containing equimolar proportions of sulphathiazole and proflavin base. It is believed that combination occurs through the acidic sulphonamide group (SO2NH) of the sulphathiazole and the basic centres of the proflavin. Perhaps the most realistic expression of the formula would be to place proflavin and sulphathiazole side by side with a comma between them.” (42) In the second half of the 20th century, interest in co-crystals evolved into the directed study of intermolecular interactions in crystalline solids (43-45). The technical development of routine single-crystal structure determination led to a watershed of data, now largely accessible through the Cambridge Structural Database (CSD) (46,47).
The structural data have become useful for understanding the intermolecular interactions in co-crystals in atomic level detail (48). Using insight gained from analysis of the CSD and directed experimentation, scientists attempt design of co-crystals with specific properties, such as color or non-linear optical response, by selecting starting components with appropriate molecular properties likely to exhibit specific intermolecular interactions in a crystal (49-52).
However, even when chemically compatible functional groups are present it is not possible to accurately predict if a co-crystal, a eutectic mixture or simply a physical mixture will result from any given experiment. As a result of these complexities, attention has been directed at the identification and characterization of intermolecular packing motifs with the goal of developing principles for co-crystal materials (53).

Figure 2. Steps involved in crystal engineering of a pharmaceutical phase, exemplified by the real example of co-crystallization of 5-fluorouracil and urea. Scientists in India have reported a rare example of synthon polymorphism in co-crystals of 4,4′-bipyridine and 4-hydroxybenzoic acid.

Polymorphism is defined as the ability of a material to exist in more than one form or crystal structure. It has important implications for the properties of such materials; for example in pharmaceuticals, the dissolution rate of a drug can be dependent on the polymorphic form. While this is a common phenomenon in single crystals it is much less common in co-crystals, systems where the structure has at least two distinct components. Gautam Desiraju from the Indian Institute of Science, found that when 4,4′-bipyridine and 4-hydroxybenzoic acid were dissolved together in a solvent such as methanol they would co-crystallise to form two different polymorphs. They noticed that a third form, a pseudopolymorph, was also present.
PROSPECTS FOR CRYSTAL ENGINEERING AND PHARMACEUTICAL CO-CRYSTALS
At the beginning of the 21st century, the field of crystal engineering has experienced significant development. Importantly, crystal engineering principles are now being actively considered for application to pharmaceuticals to modulate the properties of these valuable materials (54).
Because the physical properties that influence the performance of pharmaceutical solids are reasonably well appreciated, there is a unique opportunity to apply crystal engineering techniques and the appropriate follow-up studies to solve real world problems, such as poor physical and chemical stability or inadequate dissolution for appropriate biopharmaceutical performance of an oral drug. As structures and series of pharmaceutical co-crystals have begun to appear, we again find that properties cannot be predicted from the structures. Nevertheless, occasional trends have been suggested.
For example, insoluble drug compounds co-crystallized with highly water soluble complements tend to achieve kinetic solubilities in aqueous media several times greater than the pure form (55,56).
There are also more possible phases for each given active compound to consider, thus there will arguably be a greater opportunities for property enhancement. In terms of stability enhancement and solubilization, the example of the series of itraconazole co-crystals with pharmaceutically acceptable 1,4-diacids (55) suggests a strategy alternative to amorphous drug formulation. The co-crystal options presented retain the stability inherent in a crystalline state, while allowing for solubilization that significantly exceeds that of crystalline itraconazole base and rivals the performance of the engineered amorphous bead formulation (Sporanox®).
Where are we now? From recent literature it appears that knowledge gained over the past century and increasingly sophisticated screening techniques developed within the last decade are paving the way towards design of co-crystals with potentially improved pharmaceutical properties (55-58) In terms of the application to pharmaceutical systems, the field of crystal engineering is developing the retro-synthetic understanding of crystal structure using reasoning that is analogous to that applied by organic chemists. For example, the retro-synthetic approach in covalent synthesis operates on the level of a single molecule, while the analogous effort in crystal engineering focuses on the “supermolecule”:
 piracetam
The assemblies that define the crystalline arrangement of the molecules as they self-organize into the solid-state. The parallels between the development of crystal engineering and synthetic organic chemistry run still deeper. Methodologies for carrying out these crystallizations are being developed alongside the development of new robust motifs (6,53,55,57,60). The importance of the solubility and dissolution relationships of the components of a putative co-crystal is becoming a matter of significant investigation (56,60). The same can be said for the roles of additives in templating novel forms.
Mechanical milling of materials has also been documented as a means to make co-crystals, and a recent example of polymorphic forms of caffeine:glutaric acid illustrates the opportunities of this type of processing to influence crystal form (61). With an increase in the understanding of the modes of self-assembly, one can start to address the design aspect towards making pharmaceutical co-crystals.
There remain several limitations to the application of what is currently known to the design of useful materials. As mentioned earlier, it remains intractable to reliably predict crystal structure. Multi-component crystals are well out of reach for prediction due in part to complex energetic landscapes, lack of appropriate charge density models and a large number of degrees of freedom, making computation unfeasible. Moreover, there is only a qualitative understanding of the interplay between intermolecular interactions and materials performance, especially for properties relevant to pharmaceuticals such as solubility, dissolution profile, hygroscopicity and melting point.
But the saving grace of the co-crystal approach comes in two guises: Complementarity and diversity. On the topic of complementarity, it is possible, by way of CSD database mining for instance, to identify trends of hetero-synthon occurrence in model systems. As for the diversity aspect, the space of possible co-crystal formers is large, limited only by pharmaceutical acceptability. Coupled with parameters such as stoichiometry variation and increase in the number of components (binary systems can be expanded into ternary ones, etc.), the opportunities appear vast.
THE FUTURE OF CRYSTAL ENGINEERING IN PHARMACEUTICAL SCIENCE
READ
Novel Challenges in Crystal Engineering: Polymorphs and New …
Where are we going? At this point, we have only just scratched the surface of materials science-driven pharmaceutical product design. In the 21st century, practitioners of pharmaceutical chemistry need to enumerate and exploit the opportunities of crystal form design that nature affords us, and thus gain increasing ability to design the materials we need from the molecules that we seek to convert into pharmaceuticals.
Learning will be facilitated by advances in crystallization automation (6,62), microscopy-spectroscopy techniques (Raman and IR microscopy) and new techniques such as terahertz spectroscopy and AFM, along with increasingly sophisticated X-ray diffraction lab instrumentation. In addition, further enhancements in the data mining tools associated with the CSD operating on an ever increasing number of high-quality crystal structures will undoubtedly lead to new knowledge and principles of interaction. 
The challenge placed before pharmaceutical scientists, now and in the future, is the following: (i) to understand the requirement of a particular compound in terms of materials structure and properties, and (ii) to creatively integrate crystal engineering within the limits of pharmaceutical acceptability of components to obtain new forms of active ingredients with desirable properties for formulation and delivery. It should become the collective mantra of medicinal chemists, process engineers and pharmaceutical scientists to “design and make the material we need.” This mantra can form the common aspiration for an industry that is in significant need of innovation and productivity enhancement.
Applications and Advantages
Applications
- Drug companies can use this technology to protect themselves against others generating and patenting polymorphs
Advantages
- Having more than one solid form of a drug allows optimization of drug dissolution behavior and shelf life

IP AND POLYMORPHS


REFERENCES
| [1] | E. L Paul, H.-H. Tung, and M. Midler. Organic crystallization processes. Powder Technology, 150:133-143, 2005. |
| [2] | C. R.Gardner,, C. T. Walsh and Ö. Almarsson. Drugs as materials: Valuing physical form in drug discovery, Nature Reviews Drug Disc, 926-934, 2004. |
| [3] | W. Ostwald. Studien uber die Bildung und Umwandlung fester Korper. Z Phys Chem, 22:289, 1897. |
| [4] | L. Kofler and A. Kofler. Thermo-mikro-methoden zur Kenneichnung organischer Stoffe und stoffgemische. Innsbruck, Wagner, 1954. |
| [5] | Bernstein J., Polymorphism in Molecular Crystals. Oxford University Press: New York, New York, 2002. |
| [6] | S. L. Morissette, Ö. Almarsson, M. L. Peterson, J. Remenar, M. Read, A. Lemmo, S. Ellis, M. J. Cima and C. R .Gardner. High-throughput Crystallization: Polymorphs, Salts, Co-crystals and Solvates of Pharmaceutical Solids. Adv Drug Deliv RevB, 275-300, 2004. |
| [7] | D. Sharmistha and D. J.Grant. Crystal Structures of Drugs: Advances in Determination, Prediction and Engineering. Nature Reviews Drug Discovery,3: 42-57, 2004. |
| [8] | D. Singhal and W. Curatolo. Drug Polymorphism and dosage form design: a practical perspective. Adv Drug Deliv Rev, 56: 335-347, 2004. |
| [9] | N. Lewis. Shedding Some Light on Crystallization Issues: Lecture Transcript for the First international Symposium on Aspects of Polymorphism and Crystallization – Chemical Development Issues. Org Proc Res Dev, 4: 407-412, 2000. |
| [10] | J. Bauer, S. Spanton, R. Henry, J. Quick, W. Dziki, W. Porter and J. Morris. Ritonavir: An Extraordinary Example of Conformational Polymorphism. Pharm Res,18: 859-866, 2001. |
| [11] | A. T. Hulme, S. L. Price and D. A. Tocher. A New Polymorph of 5-Fluorouracil Found Following Computational Crystal Structure Predictions. J Am Chem Soc, 127:1116-1117, 2005. |
| [12] | J. Lucas and P. Burgess. When Form Equals Substance: The Value of Form Screening in Product Life-Cycle Management. Pharma Voice, 2004. |
| [13] | J. Lucas and P. Burgess. The Paxil Patent: Four Simple Words, One Complex Claim Construction Case. Pharmaceutical Law & Industry, 2:2004. |
| [14] | J. F. Remenar, J. M. MacPhee, B. K. Larson, V. A. Tyagi, J. Ho, D. A. McIlroy, M. B. Hickey, P. B. Shaw and Ö. Almarsson.. Salt selection and simultaneous polymorphism assessment via high-throughput crystallization: the case of sertraline, Org Proc Res Dev, 7:990-996, 2003. |
| [15] | S. R. Byrn, R. R. Pfeiffer, M. Ganey, C. Hoiberg, and G. Poochikian. Pharmaceutical Solids: A strategic approach to regulatory considerations. Pharmaceutical Research, 12:945, 1995. |
| [16] | ICH Steering Committee. 11-10-2000. Good Manufacturing Practice Guide For Active Pharmaceutical Ingredients Q7a, ICH Harmonized Tripartite Guideline. |
| [17] | Ö. Almarsson and C. R. Gardner. Novel approaches the issues of developability. Current Drug Discovery, January:21-26, 2003. |
| [18] | B. C. Hancock and G.Zografi. Characteristics and significance of the amorphous state in pharmaceutical systems. J Pharm Sci, 86:1-12, 1997. |
| [19] | A. R. M. Serajuddin. Solid Dispersion of Poorly Water-Soluble Drugs: Early Promises, Subsequent Problems, and Recent Breakthroughs. J Pharm Sci, 88:1058- 1066, 1999. |
| [20] | L.Yu. Amorphous pharmaceutical solids: preparation, characterization and stabilization. Adv Drug Deliv Rev, 48:27-42, 2001. |
| [21] | See www.tricor.com |
| [22] | Y. Wu, A. Loper, E. Landis, I. Hettrick, L. Novak, K. Lynn, C. Chen, K. Thompson, R. Higgins, S. Shelukar, G. Kwei and D. Storey. The role of biopharmaceutics in the development of a clinical nanoparticle formulation of MK-0869: a Beagle dog model predicts improved bioavailability and diminished food effect on absorption in human. Int J Pharm, 285:135-46, 2004. |
| [23] | P. H. Stahl and M. Nakano Pharmaceutical Aspects of the Drug Salt Form. Handbook of Pharmaceutical Salts: Properties, Selection, and Use. New York: Wiley-VCH/VCHA, 2002. |
| [24] | J. H. Lin, D. Ostovic and J. P. Vacca, The Integration of Medicinal Chemistry, Drug Metabolism, and Pharmaceutical Research and Development in Drug Discovery and Development, chapter 11: The Story of Crixivan®, and HIV Protease Inhibitor, in Integration of Pharmaceutical Discovery and Development (ed. Borchardt et al.), Plenum Press, New York 1998. |
| [25] | B. D. Johnson, A. Howard, R. Varsolona, J. McCauley and D. K. Ellison. Indinavir Sulfate, in Harry G. Brittain (ed),Analytical Profiles of Drug Substances and Excipients, Academic Press: San Diego, 1999; V26, pp. 319-357. |
| [26] | G.Y. Kwei, L. B. Novak, L. A. Hettrick, E. R. Reiss, D. Ostovic, A. E. Loper, C. Y. Lui, R. J. Higgins, I. W. Chen, J. H. and Lin. , Rediospecific Intestinal Absorption of HIV protease inhibitor L-735,524 in beagle dogs. Pharm Res, 12:884, 1995. |
| [27] | J. H. Lin, I.-W. Chen, K. J. Vastag, and D. Ostovic. pH-dependent oral absorption of L-735,524, a potent HIV protease inhibitor, in rats and dogs. Drug Metab Disp 23:730-735, 1995. |
| [28] | K. C. Yeh, P. J. Deutsch, H. Haddix, M. Hesney, V. Hoagland, W. D. Ju, S. J. Justice, B. Osborne, A. T. Sterrett, J. A. Stone, E. Woolf and S. Waldman. Single-Dose Pharmacokinetics of Indinavir and the Effect of Food. Antimicrob. Agents Chemother, 42:332, 1998. |
| [29] | P J. Desrosiers. The potential of preform. Modern Drug Discovery, 7:40-43, 2004. |
| [30] | E A. Collier. A crystallization / crystal engineering approach to aid salt selection – anions. UMIST – Institute of Science and Technology, Dept. of Chem. Eng. 2004. |
| [31] | O. Félix, M. W. Hosseini, A. De Cian and J. Fischer. Crystal engineering of 2-D hydrogen bonded molecular networks based on the self-assembly of anionic and cationic modules. Chem Commun, 281-282, 2000. |
| [32] | C. B. Aakeroy and M. Niewenhuzen. Hydrogen-bonded layers of hydrogen malate anions – a framework for crystal engineering. J Am Chem Soc, 116:10983-10991, 1994. |
| [33] | For example, d-glucose:sodium chloride monohydrate is described in F. v. Kobell and J. F. Prakt Chemie, 28:489, 1843. |
| [34] | Quinhydrone was described in F. Wöhler. Untersuchungen über das Chinon. Annalen, 51:153, 1844. |
| [35] | For example, A. Buguet. Cryoscopy of Organic Mixtures and Addition Compounds. Compt Rend, 149:857-8, 1910. |
| [36] | H. Grossmann. Thiourea. Chemiker-Zeitung,31:1195-6, 1908. |
| [37] | For example see, A. Damiani, P. De Santis, E. Giglio, A. M. Liquori, R. Puliti and A. Ripamonti. The crystal structure of the 1:1 molecular complex between 1,3,7,9-tetramethyluric acid and pyrene. Acta Crystallogr,19:340-8, 1965. |
| [38] | J. N. Van Niekerk and D. H. Saunder. The crystal structure of the molecular complex of 4,4′-dinitrobiphenyl with biphenyl. Acta Crystallogr,1:44, 1948. |
| [39] | S. Pekker, E. Kovats, G. Oszlanyi, G. Benyei, G. Klupp, G. Bortel, I. Jalsovszky, E. Jakab, F. Borondics, K. Kamaras, M. Bokor, G. Kriza, K. Tompa and G. Faigel. Rotor-stator molecular crystals of fullerenes with cubane. Nature Materials, 4:764-767, 2005. |
| [40] | 5-Fluorouracil:urea. C4H3N2O2F.CH4N2O; C2/c; a = 9.461(3) Å, b = 10.487(3) Å, c = 15.808(4) Å, β = 99.89(7)º; Z = 4; T = 100(2) K; GOF = 1.023, R2 = 0.0663; wR2 = 0.1753. |
| [41] | C. G. Santesson. Addition Combinations. Archiv fuer Experimentelle Pathologie und Pharmakologie, 118:313-24, 1926. |
| [42] | J. McIntosh, R. H. M. Robinson, F. R. Selbie, J. P. Reidy, H. Elliot Blake and L. Guttmann. Lancet, 249:97-99, 1945. |
| [43] | K. Hoogsteen. The crystal and molecular structure of a hydrogen-bonded complex between 1-methylthymine and 9-methyladenine. Acta Crystallogr, 16:907-16, 1963. |
| [44] | F. S. Mathews,and A. Rich. The molecular structure of a hydrogen-bonded complex of N-ethyladenine and N-methyluracil. J Mol Bio, 8(1):89-95, 1964. |
| [45] | H. M. Sobell, K. Tomita and A. Rich. The crystal structure of an intermolecular complex containing a guanine and a cytosine derivative. Proc Natl Acad Sci USA, 49:885-92, 1963. |
| [46] | F. H. Allen. The Cambridge Structural Database: A quarter of a million crystal structures and rising. Acta Crystallogr, B58:380-388, 2002. |
| [47] | I. J. Bruno,; J. C. Cole, P. R. Edgington, M. Kessler, C. F. Macrae, P. McCabe, J. Pearson and R. Taylor. New software for searching the Cambridge Structural Database and visualizing crystal structures. Acta Crystallogr, B58:389-397, 2002. |
| [48] | F. H. Allen, O. Kennard and R. Taylor. Systematic analysis of structural data as a research technique in organic chemistry Acc Chem Res, 16:146-153, 1983. |
| [49] | M. C. Etter. A new role for hydrogen-bond acceptors in influencing packing patterns of carboxylic acids and amides. J Am Chem Soc, 104:1095-6, 1982. |
| [50] | M. C. Etter and G. M. Frankenbach. Hydrogen-bond directed cocrystallization as a tool for designing acentric organic solids. Chem Mater, 1:10-12, 1989. |
| [51] | Desiraju, G. R., Crystal Engineering. The Design of Organic Solids, Materials Science Monographs 54, Elsevier, Amsterdam, 1989. |
| [52] | J. A. R. P. Sarma and G. R. Desiraju. Crystal engineering via donor-acceptor interactions. X-ray crystal structure and solid state reactivity of the 1:1 complex, 3,4-dimethoxycinnamic acid-2,4-dinitrocinnamic acid. J Chem Soc, Chem Commun, :45-46, 1983. |
| [53] | For example, C. B. Åakeroy, J. Desper and B. A. Helfrich. CrystEngComm, 6:19-24, 2004. |
| [54] | Ö. Almarsson and M. J. Zaworotko. Crystal Engineering of the Composition of Pharmaceutical Phases. Do Pharmaceutical Co-crystals Represent a New Path to Improved Medicines? Chem Commun, :1889 – 1896, 2004. |
| [55] | J. F. Remenar, S. L. Morissette, M. L. Peterson, B. Moulton, J. M. MacPhee,H. Guzmán and Ö. Almarsson. Crystal engineering of novel cocrystals of a triazole drug with 1,4-dicarboxylic acids. J Am Chem Soc, 125:8456-8457, 2003. |
| [56] | S. L. Childs, L. J. Chyall, J. T. Dunlap, V. N. Smolenskaya, B. C. Stahly and G. P. Stahly. Crystal Engineering Approach To Forming Cocrystals of Amine Hydrochlorides with Organic Acids. Molecular Complexes of Fluoxetine Hydrochloride with Benzoic, Succinic, and Fumaric Acids. J Am Chem Soc,126:13335-13342, 2004. |
| [57] | S. Fleischman, L. Morales; B. Moulton, N. Rodríguez-Hornedo, R. Bailey Walsh and M. J. Zaworotko. Crystal engineering of the composition of pharmaceutical phases.Chem Commun,186, 2003. |
| [58] | A. V. Trask, W. D. S. Motherwell and W. Jones. Solvent-drop Grinding: Green Polymorph Control of Cocrystallisation. Chem Commun, 890-891, 2004. |
| [59] | N. Variankaval, R. Wenslow, J. Murry, R. Hartman, R. Helmy, E. Kwong, S.-D. Clas, C. Dalton and I. Santos. Preparation and Solid-State Characterization of Nonstoichiometric Cocrystals of a Phosphodiesterase-IV Inhibitor and L-Tartaric Acid. Cryst Growth Des, 6:690-700 2006. |
| [60] | S. J. Hehm, B. Rodriguez-Spong and N Rodriguez-Hornedo. Phase Solubility Diagrams of Cocrystal Are Explained by Solubility Product and Solution Complexation: Cryst Growth Des, 6:592-600, 2006. |
| [61] | A. V. Trask, N. Shan, W. D. S. Motherwell, W. Jones, S. Feng, R. B. H. Tan and K. J. Carpenter. Selective Polymorph Transformation via Solvent-drop Grinding. Chem Commun,, 880-882, 2005. |
| [62] | A. V. Trask, N. Shan, W. D. S. Motherwell, W. Jones, S. Feng, R. B. H. Tan and K. J. Carpenter. Selective Polymorph Transformation via Solvent-drop Grinding. Chem Commun,, 880-882, 2005. |
63……..POLYMORPHISM AND PATENTS http://www.collegio.unibo.it/uploads/ideas/joelbernstein.pdf 64…Aprepitant case study FTIR.. READING MATERIALhttp://alpha.chem.umb.edu/chemistry/ch361/spring%2005/ftir%20polymorph.pdf 65…..READ………….An Overview of Solid Form Screening During Drug Development, http://www.icdd.com/ppxrd/10/presentations/PPXRD-10_Ann_Newman.pdf 66…..CRYSTALLIZATION..http://www.intechopen.com/books/advanced-topics-on-crystal-growth/crystallization-from-the-conformer-to-the-crystal
67International Conference on Harmonization Q6A Guideline: Specifications for New Drug Substances and Products: Chemical Substances, October 1999.
68Center for Drug Evaluation and Research Guidance: Submitting Supporting Documentation in Drug Applications for the Manufacture of Drug Substances, February 1987.
69S. Byrn, R. Pfeiffer, M. Ganey, C. Hoiberg, and G. Poochikian. Pharmaceutical solids: A strategic approach to regulatory considerations. Pharm. Res. 12:945-954 (1995). 70
- H. Brittain. Methods for the characterization of polymorphs and solvates. In H. G. Brittain (ed.) Polymorphism in Pharmaceutical Solids. Marcel Dekker, Inc., New York, 1999, pp. 227-278.
- L. X. Yu and G. L. Amidon GL. Analytical Solutions to Mass Transfer. In: G. L. Amidon, P. I. Lee, and E. M. Topp (eds.) Transport Processes in Pharmaceutical Systems. Marcel Dekker, Inc., 1999, p. 23-54.
- G. L. Amidon, H. Lennernas, V. P. Shah, and J. R. Crison. A theoretical basis for a biopharmaceutic drug classification: the correlation of in vitro drug product dissolution and in vivo bioavailability. Pharm. Res. 12:413-420 (1995).
- L. X. Yu, G. L. Amidon, J. E. Polli, H. Zhao, M. Mehta, D. P. Conner, V. P. Shah, L. J. Lesko, M.-L. Chen, V. H. L. Lee, and A. S. Hussain. Biopharmaceutics Classification System: The scientific basis for biowaiver extension. Pharm. Res. 19:921-925 (2002).
- S. R. Byrn, R. R. Pfeiffer, and J. G. Stowell. Solid-State Chemistry of Drugs. 2nd Edition, SSCI, Inc., West Lafayette, Indiana, pp. 259-366.
- H. G. Brittain and E. F. Fiese. Effect of pharmaceutical processing on drug polymorphs and solvates. In H. G. Brittain (ed.) Polymorphism in Pharmaceutical Solids. Marcel Dekker, Inc., New York, 1999, pp. 331-362.
71 CRYSTALS POLYMORPHS IN PHARMAhttp://www.fcfar.unesp.br/arquivos/475753.pdf
72 API………….POLYMORPHISM pharmaceutical ingredients (APIs).http://www.ncbi.nlm.nih.gov/pubmed/19275600
73 polymorphs and co-crystals – ICDD POWER POINT PRESENTATION
74Thermodynamic stability and transformation of pharmaceutical … http://pac.iupac.org/publications/pac/pdf/2005/pdf/7703×0581.pdf
75http://www.imc.cas.cz/nmr/projekt/ws/springer.pdf
76 High-throughput crystallization: polymorphs, salts, co-crystalsand solvates of pharmaceutical solidshttp://citeseerx.ist.psu.edu/viewdoc/download?doi=10.1.1.85.5397&rep=rep1&type=pdf
77 Crystalline Solid – University of Utah College of Pharmacy Homepharmacy.utah.edu/pharmaceutics/pdf/Crystalline.pdfForm – a term encompassing all solids – polymorphs, solvates, amorphous … inPolymorphism in Pharmaceutical Solids
78..related to xrd
- Bish, DL and Post, JE, editors. 1989. Modern Powder Diffraction. Reviews in Mineralogy, Vol. 20. Mineralogical Society of America
- Cullity, B. D. 1978. Elements of X-ray diffraction. 2nd ed. Addison-Wesley, Reading, Mass
- I. Ivanisevic, R. B. McClurg and P. J. Schields: Uses of X-Ray Powder Diffraction in the Pharmaceutical Industry, Pharmaceutical Sciences Encyclopedia: Drug Discovery, Development and Manufacturing, Ed. by Shayne C. Gad., p. 1-42 (2010).
- S. R. Byrn, S. Bates and I. Ivanisevic: Regulatory Aspects of X-ray Powder Diffraction, Part 1, American Pharmaceutical Review, p.55-59 (2005)
- D. Beckers: The power of X-ray analysis, Pharmaceutical Technology Europe (2010), p.29,30.
- M. Sakata, S. Aoyagi, T. Ogura & E. Nishibori (2007): Advanced Structural Analyses by Third Generation Synchrotron Radiation Powder Diffraction, AIP Conference Proceedings, Vol. 879, pp. 1829-1832 (2007).
- Bergamaschi, A.; Cervellino, A.; Dinapoli, R.; Gozzo, F.; Henrich, B.; Johnson, I.; Kraft, P.; Mozzanica, A.; Schmitt, B.; Shi, X.: The MYTHEN detector for X-ray powder diffraction experiments at the Swiss Light Source. J. Synchrotron Rad. 17 (2010) 653–668.
- R.B. Von Dreele, P.W. Stephens, G.D. Smith, and R.H. Blessing: The First Protein Crystal Structure Determined from X-ray Powder Diffraction Data: a Variant of T3R3 Human Insulin Zinc Complex Produced by Grinding,Acta Cryst. D 56, 1549-53 (2000).
- Margiolaki, I., Wright, J. P., Fitch, A. N., Fox, G. C. & Von Dreele, R. B.: Synchrotron X-ray powder diffraction study of hexagonal turkey egg-white lysozyme, Acta Cryst. D61, 423–432 (2005). See also: Margiolaki, I. & Wright, J. P.: Powder crystallography on macromolecules, Acta Cryst. A64, 169–180 (2008).
- Fundamentals of Crystallography,C. Giacovazzo Ed., International Union of Crystallography, Oxford Science Publications, Third Edition (2011).
- The basics of Crystallography and Diffraction (Third edition, 2010), Christopher Hammond, IUCr, Oxford Science Publications; ISBN 978-0-19-954645-9. See also: X-Ray Structure Determination, A practical Guide, George H. Stout and Lyle H. Jensen, Wiley Interscience.
- Bruni G, Gozzo F, Capsoni D, Bini M, Macchi P, Simoncic P, Berbenni V., Milanese C., Girella A., Ferrari S. and Marini A., Thermal, Spectroscopic, and Ab Initio Structural Characterization of Carprofen Polymorphs, J. Pharm. Sciences 100(6), 2321 (2011).
- Brunelli, M., Wright, J. P., Vaughan, G. B. M., Mora, A. J. & Fitch, A. N.: Solving Larger Molecular Crystal Structures from Powder Diffraction Data by Exploiting Anisotropic Thermal Expansion. Angew. Chem. (2003) 115, 2075–2078.
- T. Wessels, Ch. Baerlocher and L.B. McCusker: Single-crystal-like diffraction data from polycrystalline materials, Science (1999), 284, 477-479.
- Shankland, K., David, W. I. F., Csoka, T. & McBride, L.: Structure solution of Ibuprofen from powder diffraction data by the application of a genetic algorithm combined with prior conformational analysis, Intl. J. Pharmaceut. (1998) 165, 117–126.
- A. Altomare, C. Cuocci, C. Giacovazzo, A. Moliterni and R. Rizzi: The dual-space resolution bias correction algorithm: applications to powder data, J. Appl. Cryst. (2010). 43, 798-804.
- G.Oszlanyi and A. Suto: The charge flipping algorithm, Acta Cryst. (2008). A64, 123–134 and references herein.
- Boccaleri, E., Carniato, F., Croce, G., Viterbo, D., van Beek, W., Emerich H. and Milanesio, M.,In-situ simultaneous Raman/high-resolution X-ray powder diffraction study of transformations occurring in materials at non-ambient conditions, J. Appl. Cryst., 2007, 40, 684-693.
- Scarlett N.V.Y. and Madsen I. C., Quantification of phases with partial or no known crystal structures, Powder Diffraction (2006) 21, 278-284
- Giannini C., Guagliardi A. and Millini R., Quantitative phase analysis by combining the Rietveld and the whole-pattern decomposition methods, J. Appl. Cryst., 2002, 35, 481-490.
- Scardi, P.; Leoni, M.: Line profile analysis: pattern modeling versus profile fitting, J. Appl. Cryst. 39 (2006) 24–31. Scardi, P.; Leoni, M.: Whole Powder Pattern Modelling, Acta Crystall. A58 (2002) 190–200
- Local structure from total scattering and atomic pair distribution function (PDF) analysis, In Powder diffraction: theory and practice, (Royal Society of Chemistry, London England, 2008), Robert E. Dinnebier and Simon J. L. Billinge, Eds., pp. 464 – 493.
- Neder R. B. And Korsunskiy V. I., Structure of nanoparticles from powder diffraction data using the pair distribution function, 2005 J. Phys.: Condens. Matter 17 S125
- A. Cervellino, C. Giannini, A. Guagliardi, Determination of nanoparticle, size distribution and lattice parameter from x-ray data for monoatomic materials with f.c.c. cubic unit cell, J. Appl. Cryst. 36, 1148-1158 (2003).
- P.W. Stephens, D.E. Cox, and A.N. Fitch, Synchrotron Radiation Powder Diffraction in Structure Determination by Powder Diffraction, pp. 49-87, edited by W.I.F. David, K. Shankland, L.B. McCusker, and C. Baerlocher, (Oxford University Press, 2002)
- Joel Bernstein: Polymorphism in Molecular Crystals, IUCr Monographs on Crystallography (2002), Oxford Science Publications.
- Polymorphism in Pharmaceutical Solids, Ed. By Harry G. Brittain, Drugs and The Pharmaceutical Sciences, Vol. 192
- Tremayne, M.: The impact of powder diffraction on the structural study of organic materials., Philosophical Transactions of the Royal Society of London Series A: Chemistry and Life Sciences Triennial Issue, 362: 2691 (2004).
- Law D, Schmitt EA, Marsh KC, Everitt EA,Wang W, Fort JJ, Krill SL, Qiu Y. Ritonavir-PEG 8000 amorphous solid dispersions: in vitro and in vivo evaluations. J. Pharm. Sci. 2004; 93 (3): 563–567.
- Bruni G., Berbenni V., Milanese C., Girella A., Cardini A., Lanfranconi S. and Marini A.,Determination of the nateglinide polymorphic purity through DSC, J. Pharm. and Biomed. Anal. 54 (2011) 1196-1199.
- Aaltonen J., Alleso M., Mirza S., Koradia V., Gordon K.C and Rantanen J., Solid form screening – A review. European Journal of Pharmaceutics and Biopharmaceutics 71 (2009), 23-37.
- Srivastava D., The Food and Drug Administration and Patent Law at a Crossroads: The Listing of Polymorph Patents as a Barrier to Generic Drug Entry. Food and Drug Law Journal, Vol. 59, No.2 (2004), 339-354.
- Grabowski H. G., Kyle M., Mortimer R., Long G. & Kirson N., Evolving Brand-name And Generic Drug Competition May Warrant A Revision Of The Hatch-Waxman Act. Health Affairs, 30, no.11 (2011):2157-2166.
- Rakowski W. A and Mazzochi D. M., The case of disappearing polymorph: ‘Inherent anticipation’ and the impact of Smithkline Beecham Corp. v Apotex Corp. (Paxil®) on patent validity and infringement by inevitable conversion’. Journal of Generic Medicine, Vol.1, No.2 (2006):131-139.
- Cabri W., Ghetti P., Pozzi G. and Alpegiani M., Polymorphisms and Patent, Market, and Legal Battles: Cefdinir Case Study. Organic Process Research & Development 2007, 11, 64-72.
- Bauer J, Spanton S, Henry R, Quick J, Dziki W, Porter W, Morris J., Ritonavir: an extraordinary example of conformational polymorphism, Pharm Res. 2001 Jun;18(6):859-66.
79………..related to estimation
- McCrone, W.C. in Physics and Chemistry of the Organic Solid State, Vol. 2, (Eds.: D. Fox, M.M. Labes, A. Weissberger), Interscience, New York, 1965, pp. 725-767.
- Bernstein, J., Davey, R.L., and Henck, JO, Concomitant Polymorphism, Angew.Chem.Int. Ed. 1999,38, 3440-3461.
- Polymorphism in Pharmaceutical Solids, Second Edition (Drugs and the Pharmaceutical Sciences) Harry G. Brittain (Editor) Informa HealthCare; 2nd edition (July 27, 2009)
- Otsuka, M., Kato, F. and Matsuda, Y., Determination of indomethacin polymorphic contents by chemometric near-infrared spectroscopy and conventional powder X-ray diffractometry, Analyst, 2001, 126, 1578 – 1582.
- Patel, A.D., Luner, P. E. and Kemper, M. S., Low-level Determination of Polymorph composition in Physical Mixtures by Near-Infrared Reflectance Spectroscopy, J Pharm Sci 2001, 90, 360-370.
- Agatonovic-Kustrin S, Wu V, Rades, T, Saville, D, Tucker, I G, Powder diffractometric assay of two polymorphic forms of ranitidine hydrochloride Int J Pharm 1999, 184, 107.
- Hurst, V.J., Schroeder, P.A., and Styron, R.W. Accurate quantification of quartz and other phases by powder X-ray diffractometry. Analytica Chimica. Acta, 1997, 337, 233-252
- Campbell Roberts, S.N., Williams A.C., Grimsey, I.M., and Booth S.W., Quantitative analysis of mannitol polymorphs. X-ray powder diffractometry—exploring preferred orientation effects J. Pharm. Biomed. Anal., 2002, 28, 1149-1159.
SEE
PART 1………..http://drugsynthesisint.blogspot.in/p/gliptin-series.html
PART 2 ……http://organicsynthesisinternational.blogspot.in/p/gliptin-series-22.html
